
Hello, askSlim members! Welcome to the askSlim SIR Daily Snapshot.Today’s post includes a detailed short-term technical snapshot of the S&P 500 (SPX), Nasdaq 100 (NDX) and Russel 2000 (RUT). Feel free to share your comments and feedback below. Enjoy!
Important Notes:
- NEW…After numerous requests from members we have now added our “Reversal Scout” HMA momentum indicator to our SIR Daily Snapshot Intraday Grid. You will be able to view this indicator live on our stream! This indicator is designed to provide an indication of the likely intraday directional bias as well as potential intraday turning points as its momentum condition shifts from positive to negative and vice versa. A positive momentum condition is reflected when the indicator is green and a negative momentum condition is reflected when the indicator is purple.
- View the SIR Daily Snapshot Intraday Chart Grid Live Stream BETA!
- TODAY’s LINK https://zoom.us/j/855465841?pwd=U0hpdmdRR2lZTHFLVnM0UFI0T3ZGQT09
- Click on the “expand arrows” to see the Technical Overview section for each of the indexes.
- Click on the charts and images for the full size.
PRO TIP: S&P 500 – (SPX) S-T Directional Bias (few days to few weeks outlook): The sum of the evidence at this time suggests a neutral overall short-term technical condition. We continue to keep a close eye on the price action’s impact on the technical conditions at multiple time frames. Upside Overview: Downside Overview: 15 minute Chart with Intraday Support, Resistance, HMA (Reversal “Scout”) and Breakout/Acceleration Zones- (with upcoming session view) 15 minute Chart with Intraday Support, Resistance, HMA (Reversal “Scout”) and Breakout/Acceleration Zones- (with upcoming session view) 2-HR Chart with Slim Ribbon Momentum Indicator, HMA (Reversal “Scout”) and Key S-T Support & Resistance Zones Slim’s Annotated NDX Daily Chart with additional Slim Ribbon Momentum Indicator and Hull Moving Average (“Reversal Scout”) 15 minute Chart with Intraday Support, Resistance, HMA (Reversal “Scout”) and Breakout/Acceleration Zones- CHART (with upcoming session view) Slim’s Annotated RUT Daily Chart with additional Slim Ribbon Momentum Indicator and Hull Moving Average (“Reversal Scout”) TECHNICAL EVIDENCE COMPARISON Momentum Tracker & Charts *askSlim Trend & Momentum Tracker Helpful Tips: DISCLAIMERS Askslim.com, Inc. owns and operates the website known as: www.askslim.com. All of the information on www.askslim.com is solely for entertainment, informational and educational purposes only and is not investment or trading advice. None of the information on the Website or in emails is guaranteed to be accurate, complete, useful or timely. Please go askslim.com for the full disclaimer, terms and conditions and privacy policy
It is a fundamental truth that the inherent nature of the markets always offers the possibility that anything can happen. Risk is always present for upside and downside surprises. As traders, we should be cognizant of this fact and structure our trade planning and risk management accordingly – whether the technical evidence is clearly bullish, bearish or neutral with mixed signals. At askSlim we are bull/bear agnostic. The market messages drive our technical outlook. The analysis contained in the SIR products is developed as much as possible from a proprietary blend of objectively engineered trend, momentum and cycle studies and we look for alignment at multiple timeframes so we can provide the highest probability of directional bias along with projected key support and resistance levels. We will always provide upside and downside viewpoints as well.
Technical Overview


2-HR Chart with Slim Ribbon Momentum Indicator, HMA (Reversal “Scout”) and Key S-T Support & Resistance Zones and Technical Notes
Slim’s Annotated SPX Daily Chart with additional Slim Ribbon Momentum Indicator and Hull Moving Average (“Reversal Scout”) 
NASDAQ 100 – (NDX)
Technical Overview


RUSSEL 2000 – (RUT)
Technical Overview

2-HR Chart with Slim Ribbon Momentum Indicator, HMA (Reversal “Scout”) and Key S-T Support & Resistance Zones 

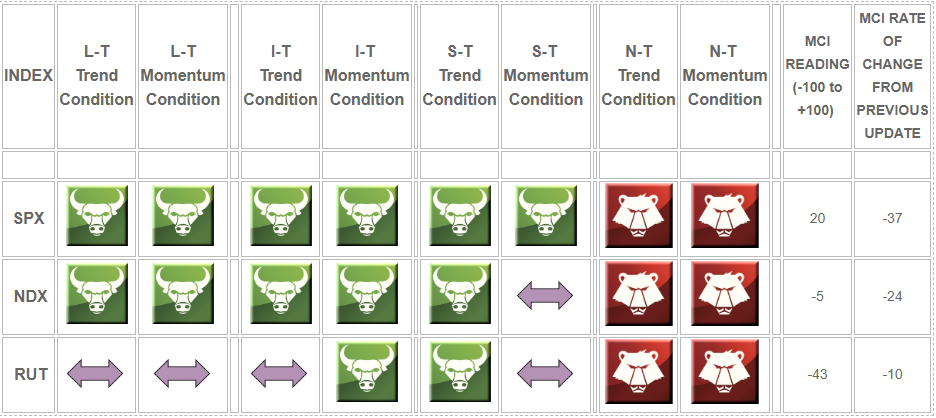
2hr Intraday Area Chart “Comparison” with SLIM Ribbon Momentum Indicator & MCI
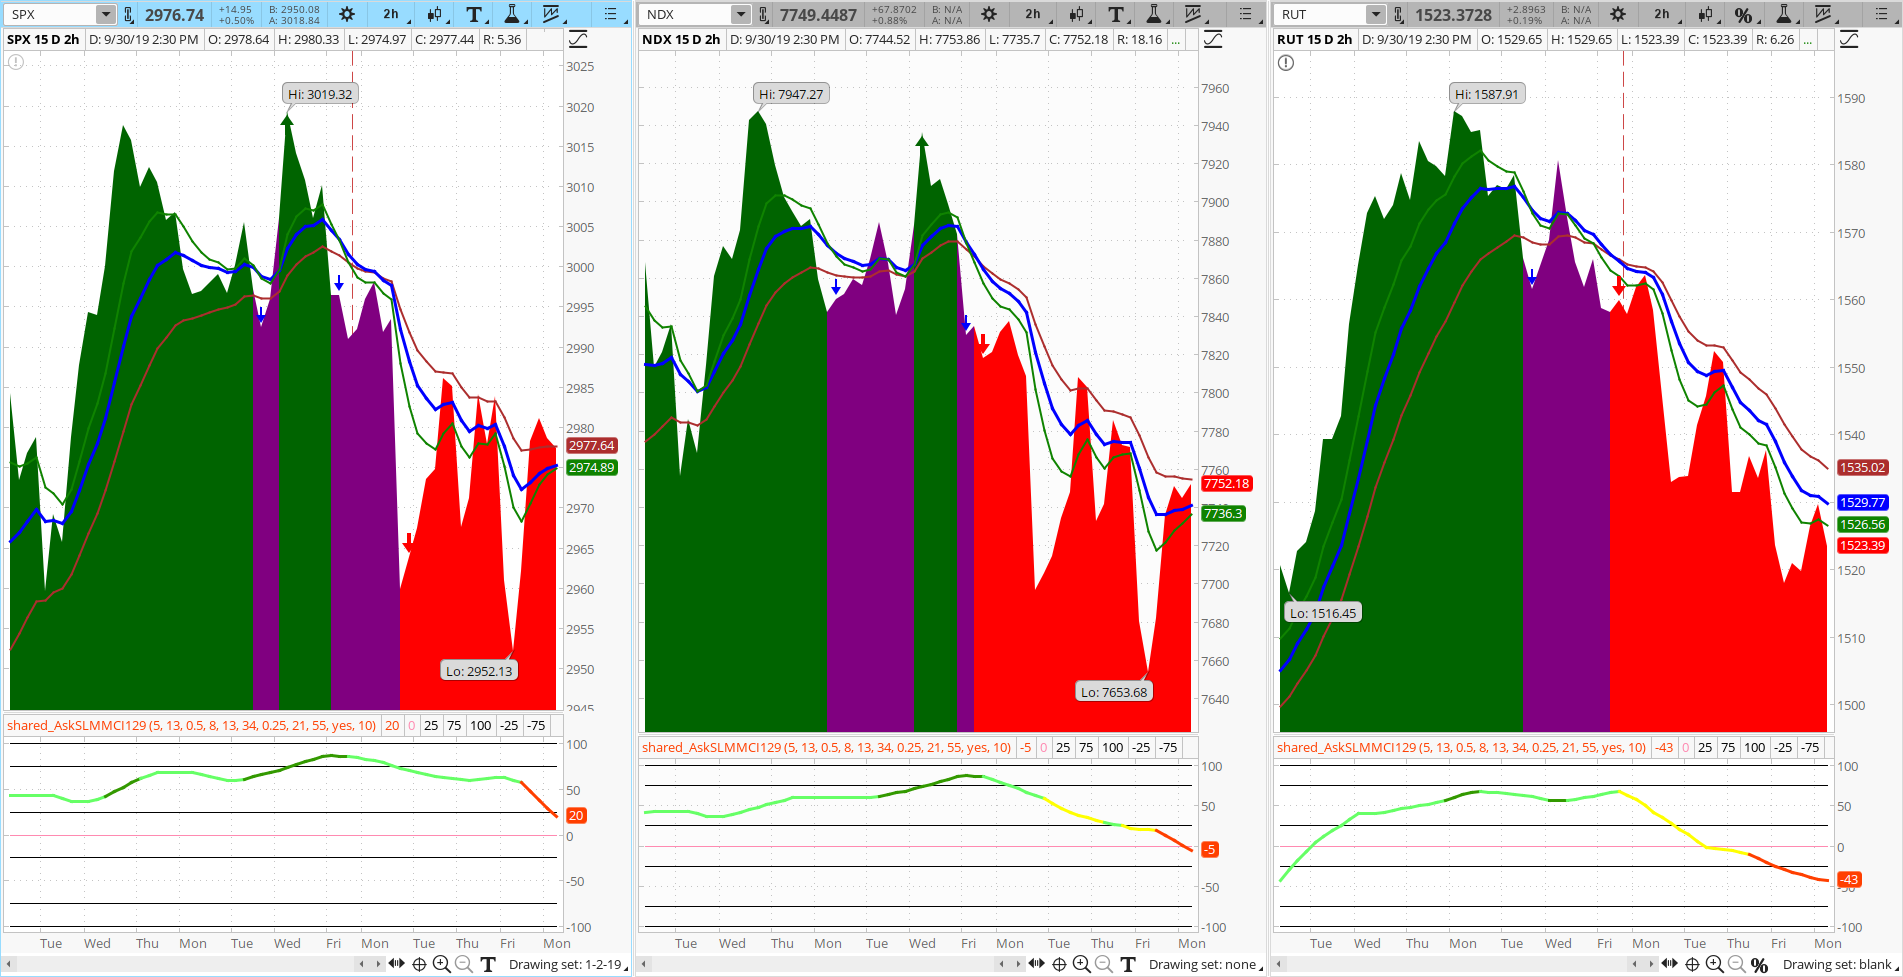
Green = Positive Momentum
Red = Negative Momentum
Purple = Neutral Momentum
Green = Positive Condition
Purple = Negative Condition

