
Hello, askSlim members! Welcome to the preview and beta testing period for the new askSlim SIR Daily Snapshot. This new service is designed for short-term index swing traders looking for technical insights into the market’s short-term directional bias and key support and resistance levels at multiple timeframes.
Today’s preview includes a detailed short-term technical snapshot of the S&P 500 (SPX), Nasdaq 100 (NDX) and Russel 2000 (RUT). ALSO, included today are Slim’s updated annotated Daily and Weekly Charts!
We will be extending the preview and beta test period until July 5, 2019. Please note, once the beta test period has ended the new SIR Daily Snapshot will be included as part of our Level 2, 3 and 4 askSlim premium memberships. NOTE: Click on the “expand arrows” to see the Technical Overview section for the indexes. Remember to click on the charts and images for the full size.
PRO TIP: S&P 500 – (SPX) S-T Directional Bias (few days to few weeks outlook): The sum of the current technical evidence suggests a very bullish overall short-term condition. At this point, the SPX would need to close below 2825 to neutralize the overall short-term positive trend condition. Upside Overview: Downside Overview: 5 Day_15 minute Chart with Intraday Support, Resistance and Breakout/Acceleration Zones- CHART A (with upcoming session view) Slim’s Annotated SPX Weekly Chart 5 Day_15 minute Chart with Intraday Support, Resistance and Breakout/Acceleration Zones- CHART A (with upcoming session view) 20 Day_2-HR Chart with Slim Ribbon Momentum Indicator, HMA (Reversal “Scout”) and Key S-T Support & Resistance Zones and Technical Notes Slim’s Annotated NDX Daily Chart with additional Slim Ribbon Momentum Indicator and Hull Moving Average (“Reversal Scout”) Slim’s Annotated NDX Weekly Chart 5 Day_15 minute Chart with Intraday Support, Resistance and Breakout/Acceleration Zones- CHART A (with upcoming session view) 20 Day_2-HR Chart with Slim Ribbon Momentum Indicator, HMA (Reversal “Scout”) and Key S-T Support & Resistance Zones and Technical Notes Slim’s Annotated RUT Daily Chart with additional Slim Ribbon Momentum Indicator and Hull Moving Average (“Reversal Scout”) Slim’s Annotated RUT Weekly Chart TECHNICAL EVIDENCE COMPARISON Momentum Tracker & Charts *askSlim Trend & Momentum Tracker Helpful Tips: DISCLAIMERS Askslim.com, Inc. owns and operates the website known as: www.askslim.com. All of the information on www.askslim.com is solely for entertainment, informational and educational purposes only and is not investment or trading advice. None of the information on the Website or in emails is guaranteed to be accurate, complete, useful or timely. Please go askslim.com for the full disclaimer, terms and conditions and privacy policy
It is a fundamental truth that the inherent nature of the markets always offers the possibility that anything can happen. Risk is always present for upside and downside surprises. As traders, we should be cognizant of this fact and structure our trade planning and risk management accordingly – whether the technical evidence is clearly bullish, bearish or neutral with mixed signals. At askSlim we are bull/bear agnostic. The market messages drive our technical outlook. The analysis contained in the SIR products is developed as much as possible from a proprietary blend of objectively engineered trend, momentum and cycle studies and we look for alignment at multiple timeframes so we can provide the highest probability of directional bias along with projected key support and resistance levels. We will always provide upside and downside viewpoints as well.
Technical Overview


20 Day_2-HR Chart with Slim Ribbon Momentum Indicator, HMA (Reversal “Scout”) and Key S-T Support & Resistance Zones and Technical Notes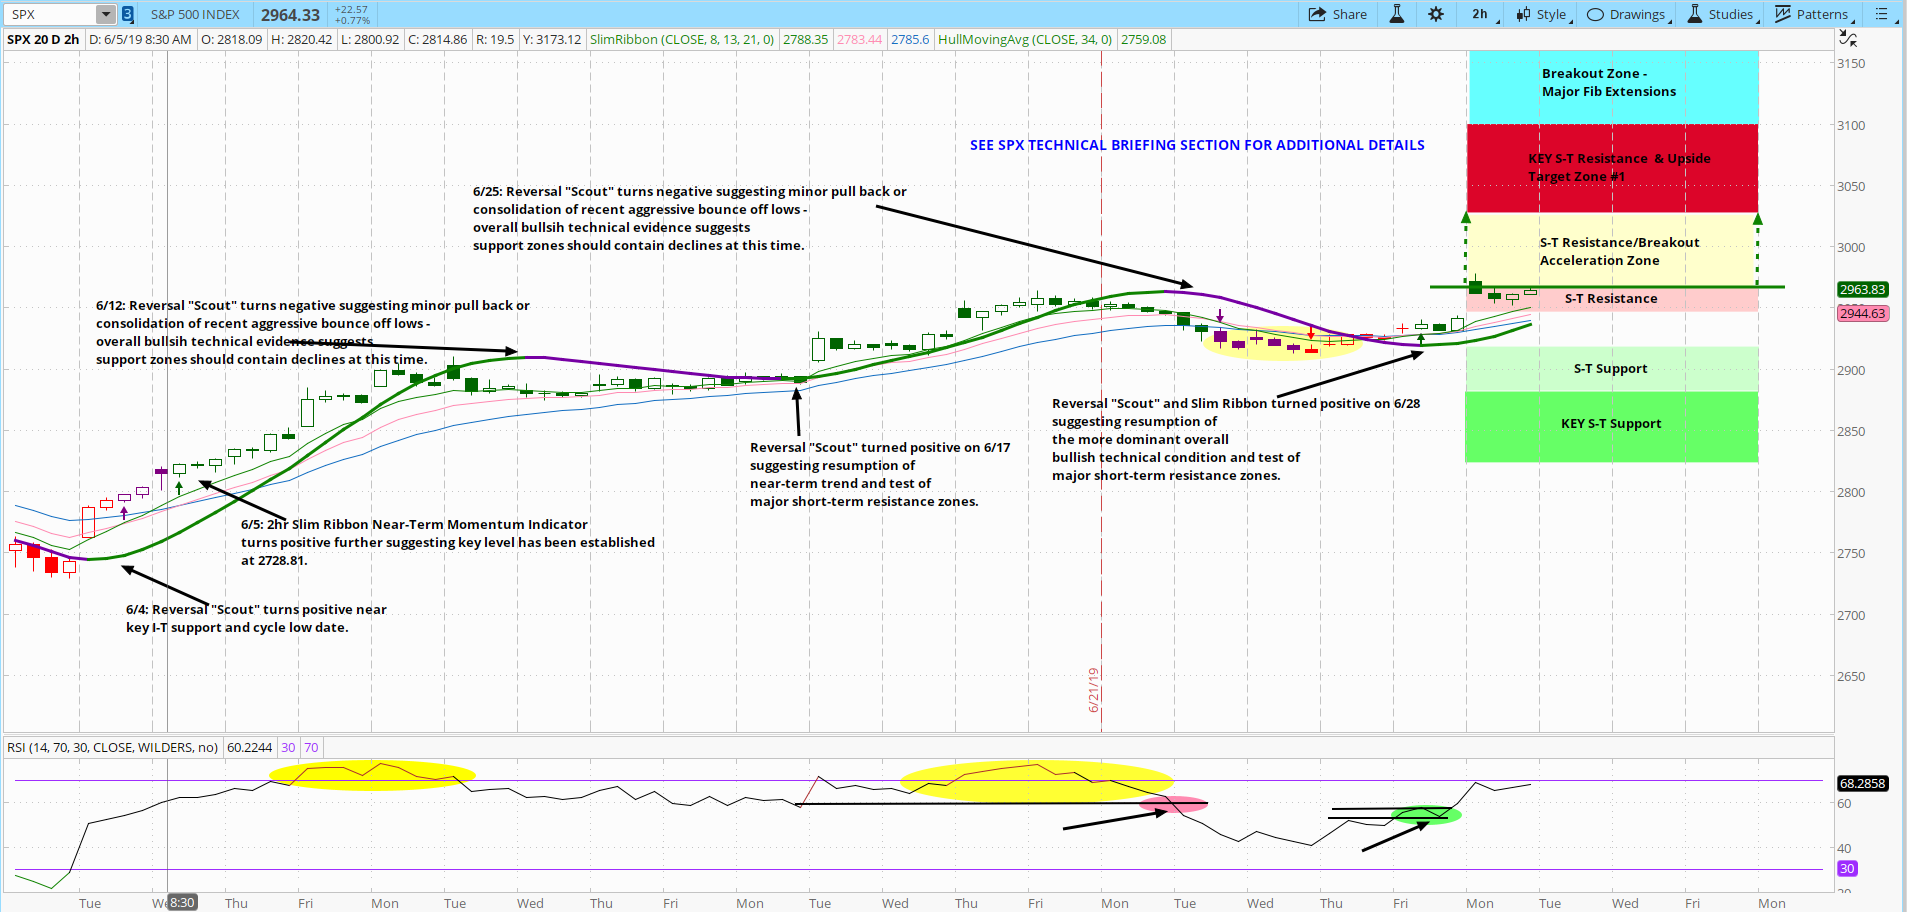
Slim’s Annotated SPX Daily Chart with additional Slim Ribbon Momentum Indicator and Hull Moving Average (“Reversal Scout”) 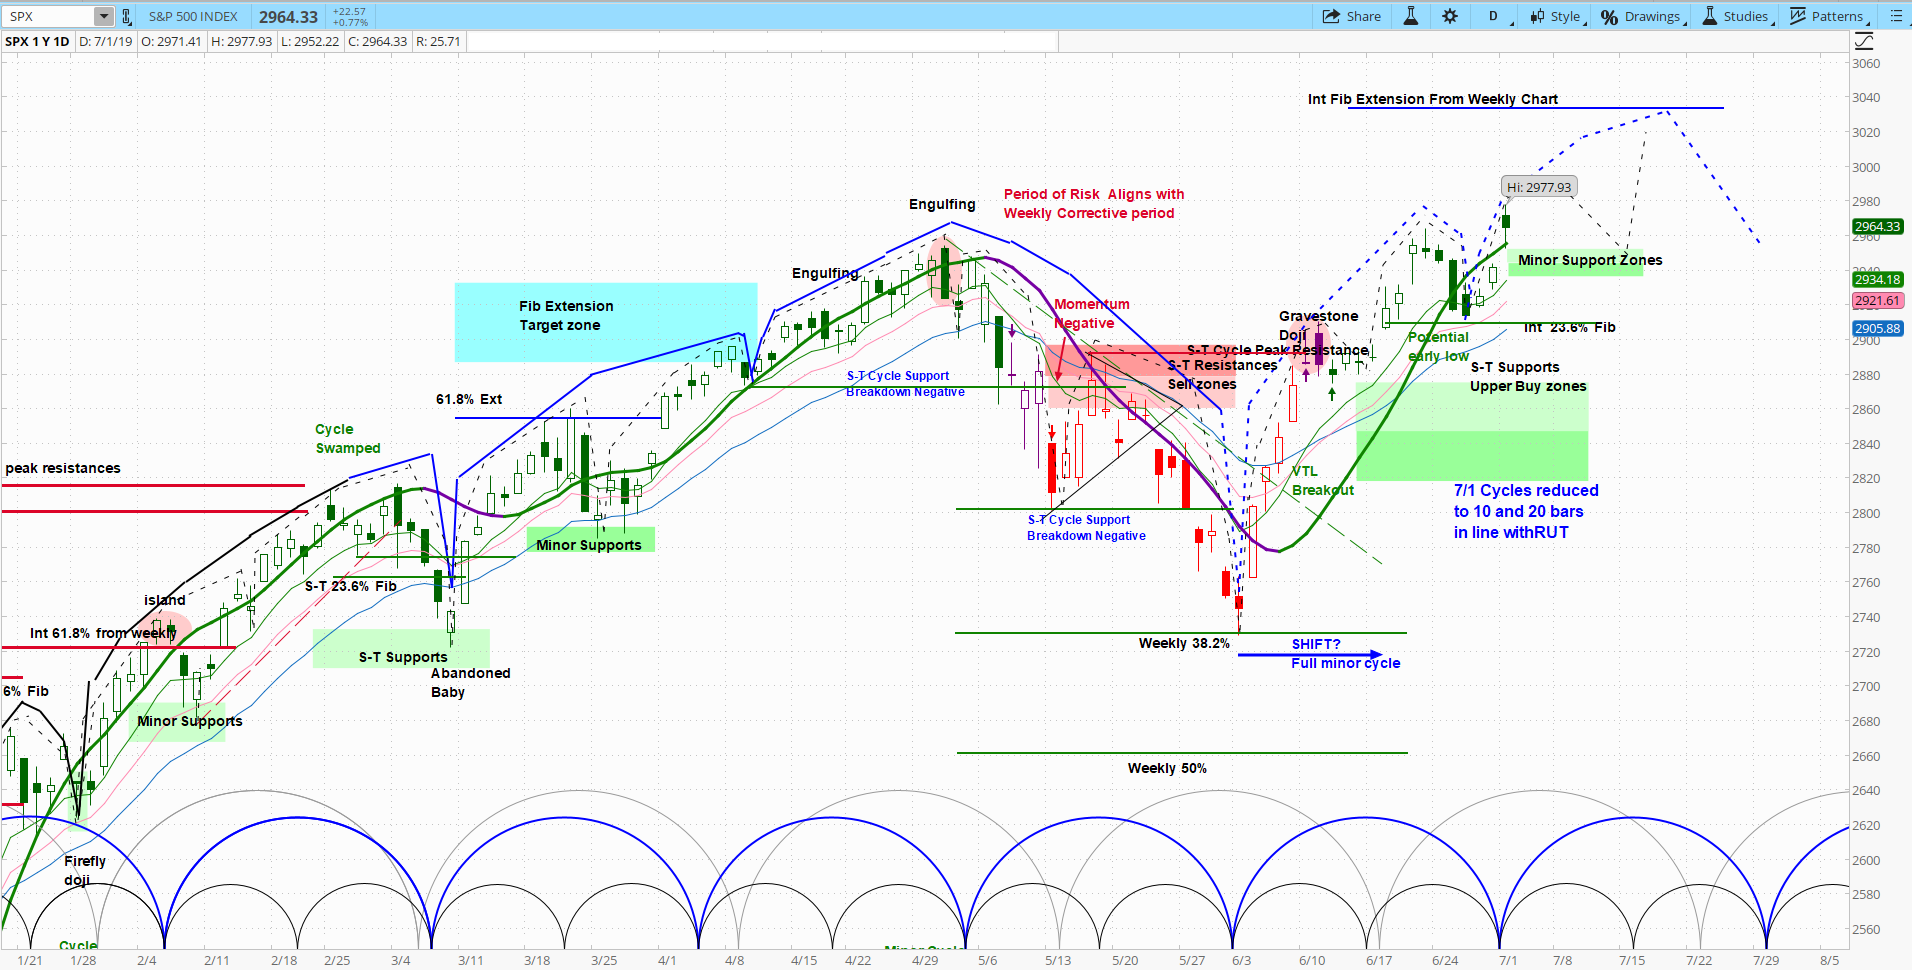

NASDAQ 100 – (NDX)
Technical Overview


RUSSEL 2000 – (RUT)
Technical Overview


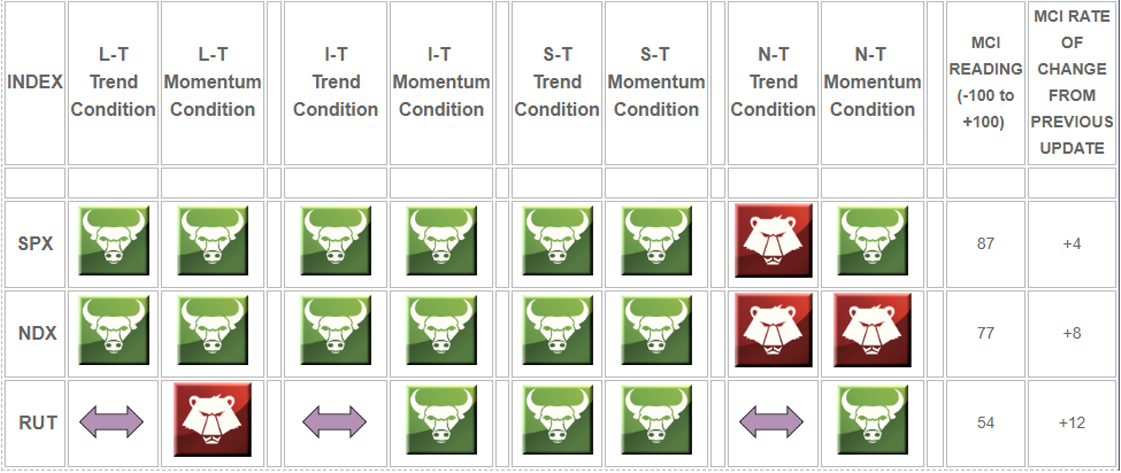
2hr Intraday Area Chart “Comparison” with SLIM Ribbon Momentum Indicator & MCI
Green = Positive Momentum
Red = Negative Momentum
Purple = Neutral Momentum
Green = Positive Condition
Purple = Negative Condition


Very useful and concise market information without the noise. If somehow one could capture political and geopolitical volatility/noise that could impact markets, as a separate “not to be taken too seriously” section might be helpful.
Thanks Zafar! We appreciate the comments.
Excellent service, But think it should be included with level 1 when it launches. I mean the key is to get people in the door then they will upgrade as they see the real value in the service.
Hi Keith. We appreciate the comments and feedback!
We would love to offer the Daily SIR Snapshot as part of our Level 1 askSlim membership, however, the production effort and technical analysis tools required unfortunately don’t lend it to be feasible for us to do so.
Matt, this is good stuff. For me, the only thing that would make it easier to use would be if it was organized by “trader type”. If I am an Intraday Swing Trader it would be helpful to have all those items grouped together. Same if I am a Short-term Swing Trader. Otherwise, you and your team have done great work. I do access and review every update. Thanks!
Hey John. Great to hear from you! We appreciate the comments. Let me take the suggestion back to the team for consideration.