
This morning, DR Horton (DHI) reported fiscal Q2 earnings. The company reported adjusted EPS of $1.30, which beat consensus estimates of $1.12. Revenues came in at $4.5B, which missed consensus estimates of $4.57B. DHI noted an increase in sales cancellations and decrease in month-to-date orders due to COVID-19. The company withdrew its fiscal 2020 guidance. Heading into the earnings report, DHI was down 32.67% from February 2020 highs. The stock rallied over 10% midway through Tuesday’s trading session. Let’s review our weekly analysis.
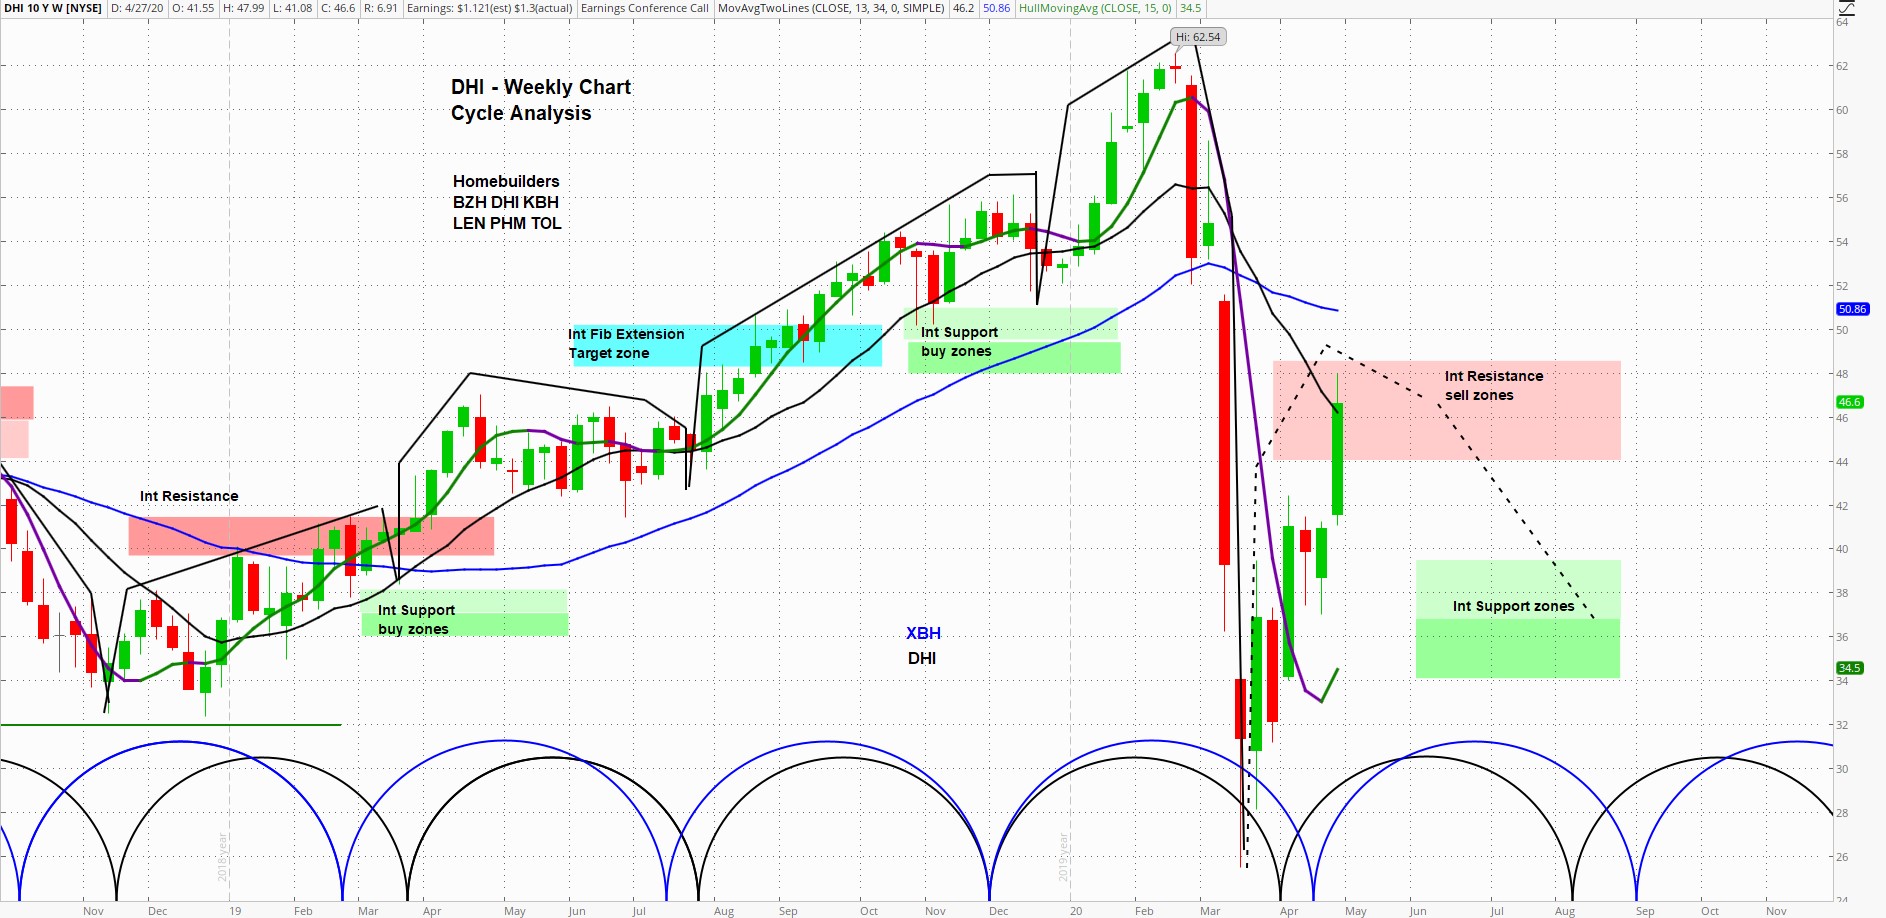
DR Horton (DHI) – annotations by askSlim.com
At askSlim.com we use technical analysis to evaluate price charts of stocks, futures, and ETF’s. We use a combination of cycle, trend and momentum chart studies, on multiple timeframes, to present a “sum of the evidence” directional outlook in time and price.
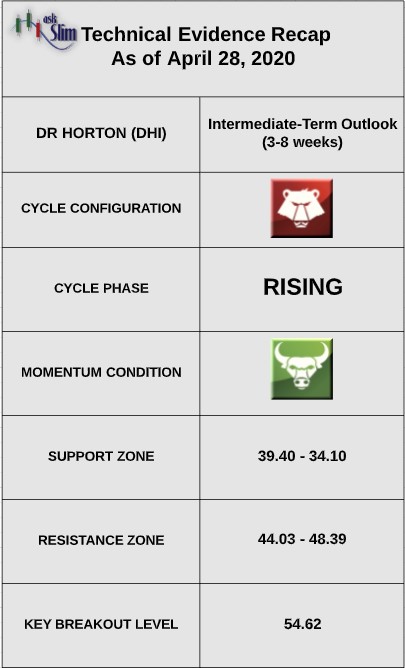
askSlim.com Technical Briefing: The weekly cycle analysis suggests that the stock is in a rising phase in an overall bearish pattern. The next projected intermediate-term low is due in August.
On the upside, there is an intermediate-term resistance zone from 44.03 – 48.39. On the downside, there is a support zone from 39.40 – 34.10. For the bulls to regain control of the intermediate-term, we would need to see a weekly close above 54.62.
askSlim.com Sum of the Evidence: DHI is testing an intermediate-term resistance zone in an overall bearish pattern. We would expect the stock to fail in this zone between 44 – 48 and pullback to 37 by August.
Interested in askSlim.com?
Get professional grade technical analysis, trader education and trade planning tools at askSlim.com. Write to matt@askslim.com for special askSlim membership trial offers!

