
In Monday’s session, Electronic Arts (EA) was up more than 3% as a bid returned to the stay at home stocks. In this post, we will review our weekly cycle analysis in Electronic Arts.
Electronic Arts (EA) Weekly Cycle Analysis – annotations by askSlim.com

At askSlim.com we use technical analysis to evaluate price charts of stocks, futures, and ETF’s. We use a combination of cycle, trend and momentum chart studies, on multiple timeframes, to present a “sum of the evidence” directional outlook in time and price.
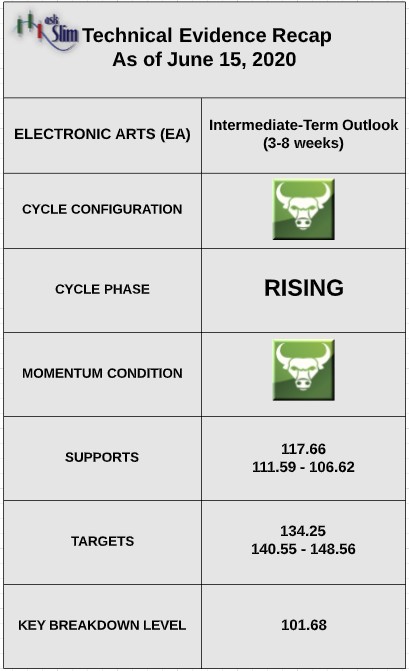
askSlim.com Technical Briefing: EA’s weekly cycle analysis suggests that the stock is in a rising phase. Weekly momentum is positive. The next projected low is due in the end of October.
On the upside, there is a 61.8% Fibonacci extension at 134.25 followed by a Fibonacci extension zone from 140.55 – 148.56. On the downside, there is an intermediate-term support at 117.66 followed by another zone of support from 111.59 – 106.62.
askSlim.com Sum of the Evidence: EA is in a rising phase with positive momentum on the weekly. Given these conditions, there is a likelihood that the upward momentum will carry the stock up to 134 by September before the risks of a pullback increase.
Interested in askSlim.com?
Get professional grade technical analysis, trader education and trade planning tools at askSlim.com. Write to matt@askslim.com for special askSlim membership trial offers!

