
Barclays downgraded First Solar (FSLR) from Overweight to Underweight and dropped their price target from $66 to $49. The analyst cited industry data on 5,000 projects both operational and in the company’s pipeline. The analyst believes First Solar is rapidly losing share of the U.S. downstream market. Let’s see what the chart tells us.
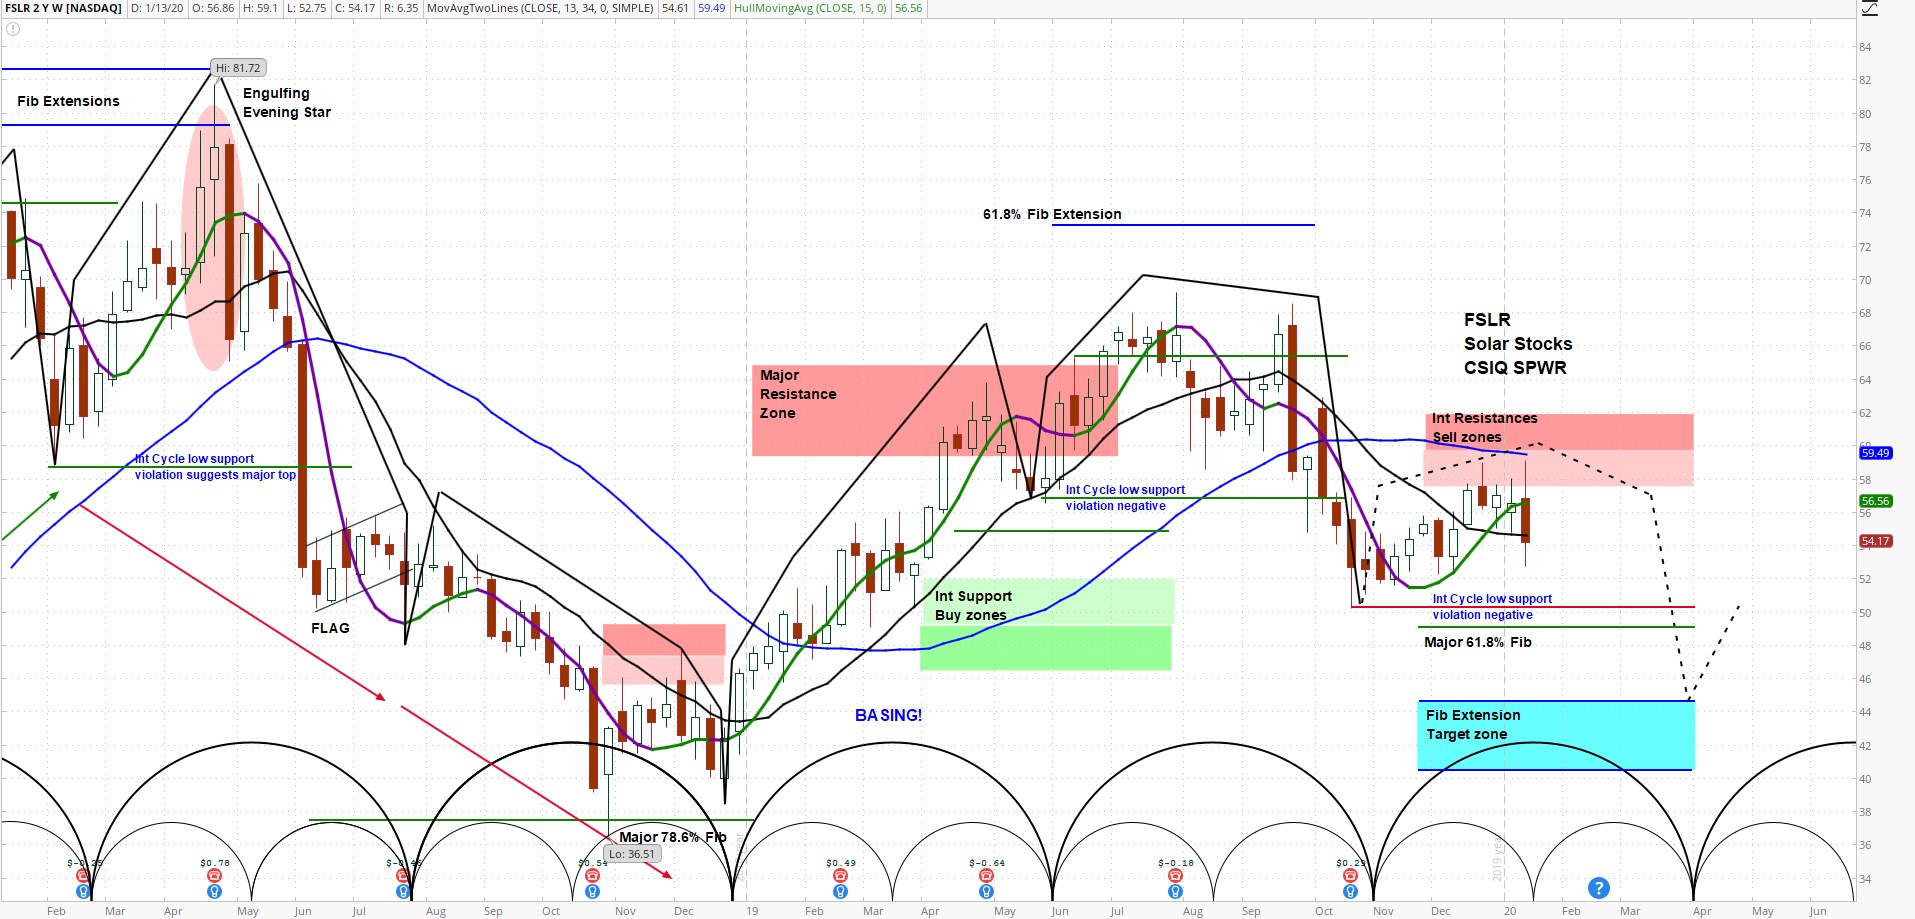
First Solar (FSLR) Weekly Chart – annotations by askSlim.com
At askSlim.com we use technical analysis to evaluate price charts of stocks, futures, and ETF’s. We use a combination of cycle, trend and momentum chart studies, on multiple timeframes, to present a “sum of the evidence” directional outlook in time and price.
askSlim.com Technical Briefing: The current negative weekly cycle configuration suggests that rallies will be within the context of an intermediate-term declining phase over the next couple of months. On the upside, there are intermediate-term resistance zones from 57.48 – 61.97. On the downside, there is key cycle low support at 50.22 followed by a major Fibonacci support at 49.01. A weekly close below 50.22 would increase the odds of a test of the Fibonacci extension/target zone between 44.69 – 40.77. Our analysis suggests that for the bulls to regain control of the intermediate-term, we would likely need to see a weekly close above 61.97.
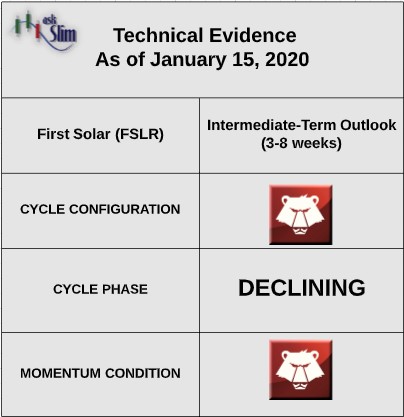
Sum of the evidence: FSLR’s intermediate-term condition is negative. The alignment of negative cycle conditions and negative weekly momentum is likely to carry the stock to the Fibonacci extension/target zone between 44.69 – 40.77 in the coming months.
Interested in askSlim.com?
Get professional grade technical analysis, trader education and trade planning tools at askSlim.com. Write to matt@askslim.com for special askSlim membership trial offers!

