
Last night, IBM (IBM) reported first quarter earnings results. The company reported adjusted EPS of $1.84, which beat consensus estimates of $1.81. Revenue came in at $17.57B, which missed forecasts of $17.7B. IBM withdrew their fiscal year 2020 guidance given the uncertainty surrounding COVID-19. IBM noted that there was a sharp slowdown in software sales during late March. This raised concerns about the pending earnings results for the rest of the enterprise software industry. IBM traded down 6% midway through Tuesday’s trading session. Given this background, let’s see what the charts tell us.
IBM (IBM) Weekly Chart – annotations by askSlim.com
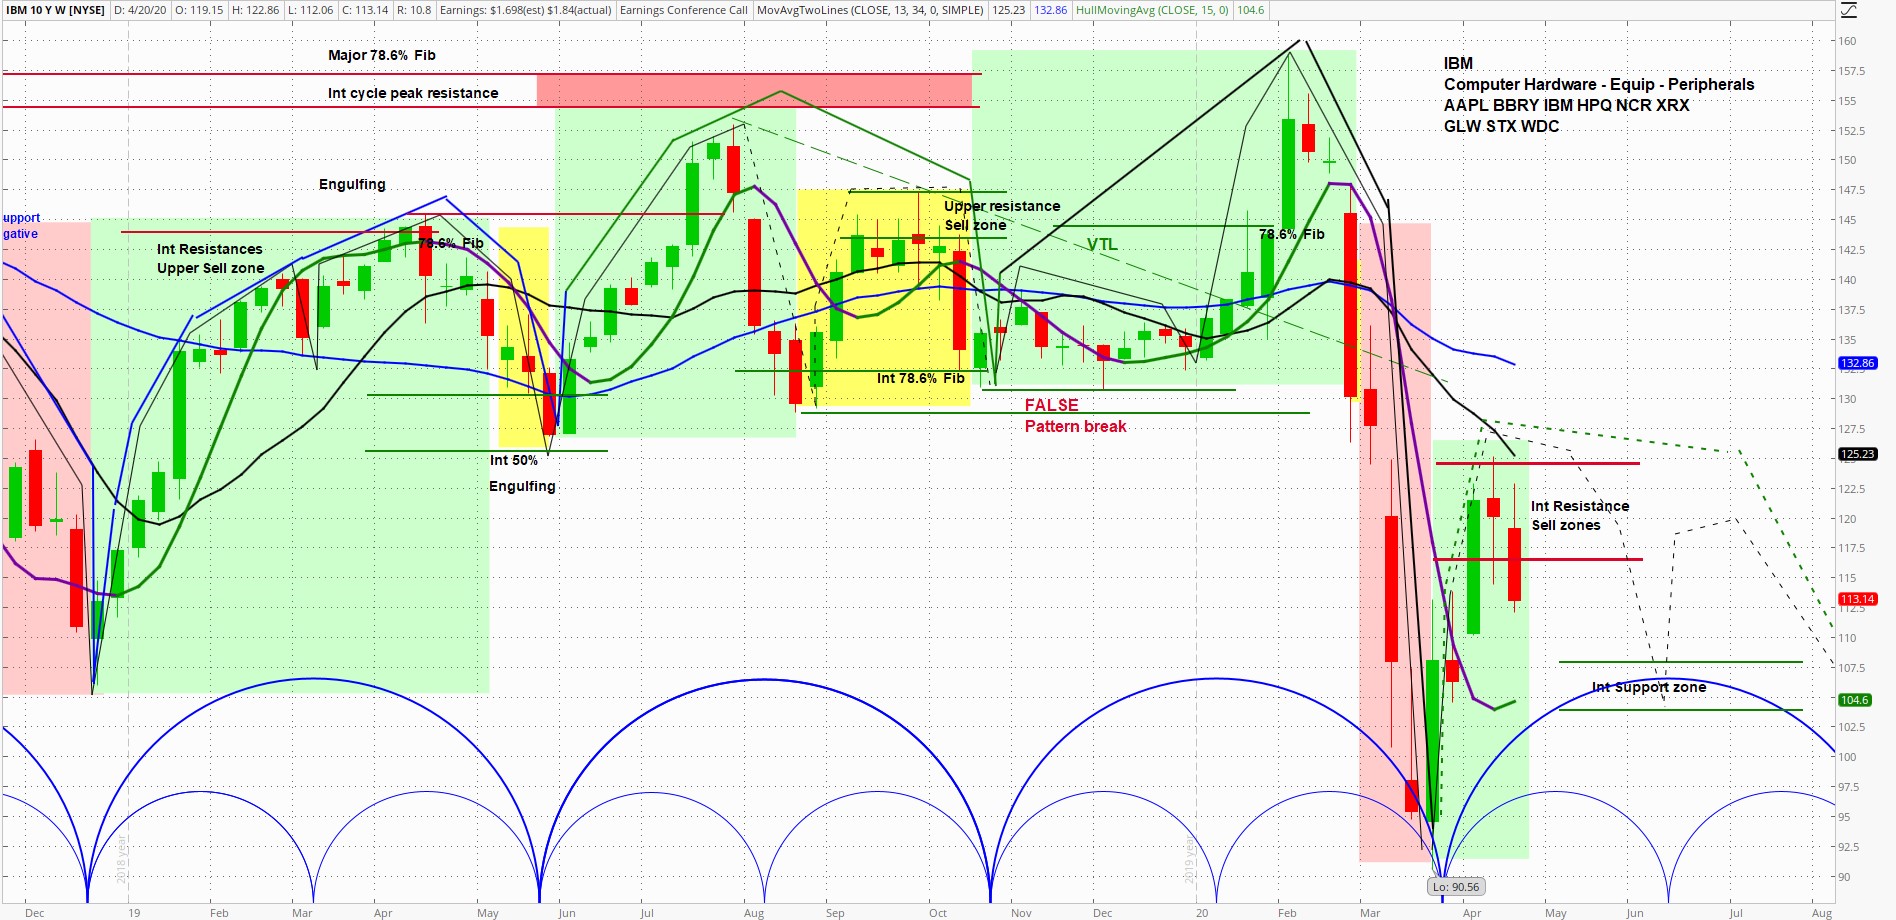
At askSlim.com we use technical analysis to evaluate price charts of stocks, futures, and ETF’s. We use a combination of cycle, trend and momentum chart studies, on multiple timeframes, to present a “sum of the evidence” directional outlook in time and price.
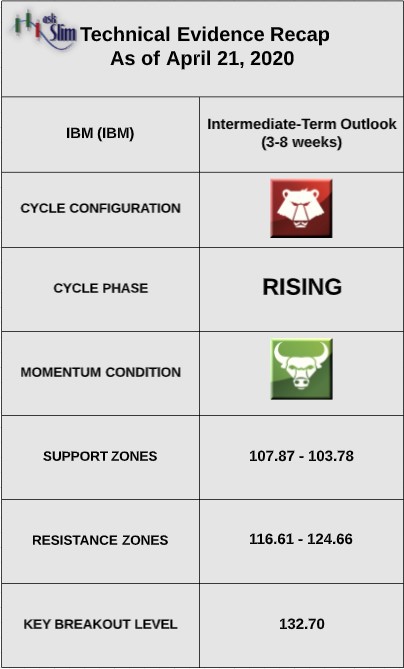
askSlim.com Technical Briefing: The weekly cycle analysis suggests that IBM is in an intermediate-term rising phase in a longer-term negative pattern. Weekly momentum is positive.
On the upside, there is an intermediate-term resistance zone from 116.61 – 124.66. On the downside, there is an intermediate-term support zone from 107.87 – 103.78. For the bulls to regain control of the intermediate-term, we would need to see a weekly close above 132.70.
askSlim.com Sum of the Evidence: IBM is in an intermediate-term rising phase in a negative longer-term pattern. Under these conditions, we would expect IBM to fail in the intermediate-term resistance zone beginning at 116.61. There is a likelihood that the stock trades down to 104 by mid-June.
Interested in askSlim.com?
Get professional grade technical analysis, trader education and trade planning tools at askSlim.com. Write to matt@askslim.com for special askSlim membership trial offers!

