
Johnson & Johnson (JNJ) announced Monday that the company would begin testing its experimental coronavirus vaccine in September. The company said the vaccine could be available for emergency use in early 2021. Johnson & Johnson shares rallied over 7% on the news. Let’s see what the charts tell us.
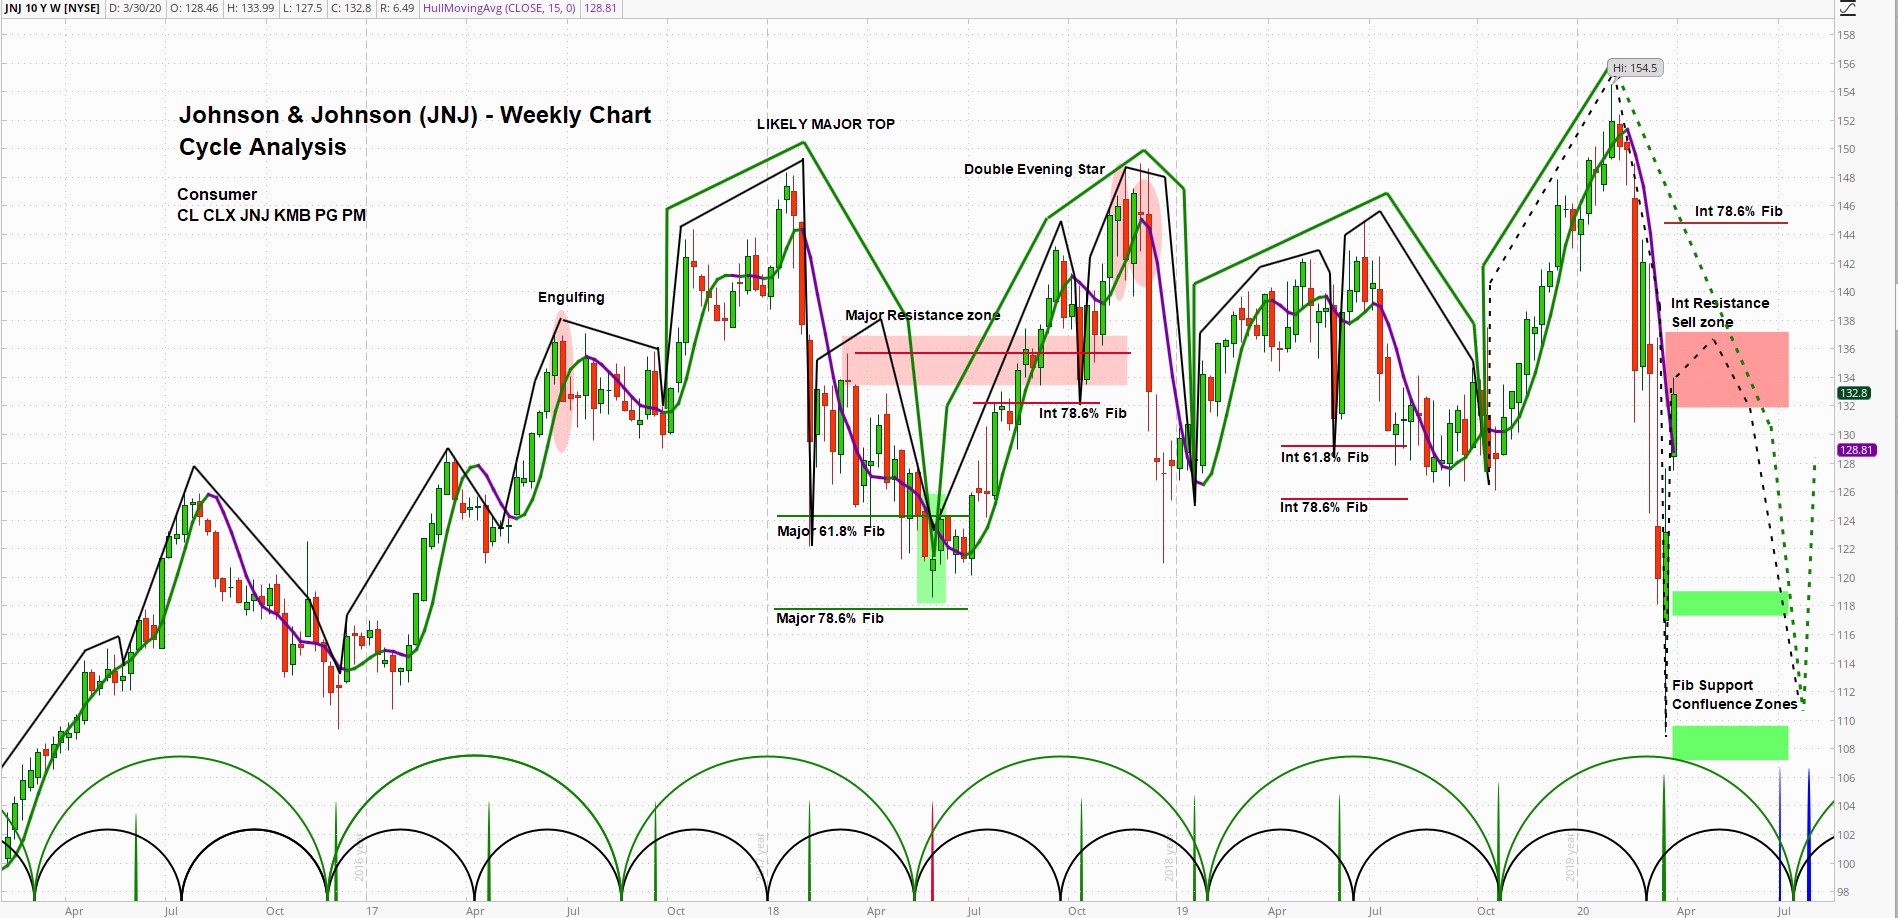
Johnson & Johnson (JNJ) Weekly Chart – annotations by askSlim.com
At askSlim.com we use technical analysis to evaluate price charts of stocks, futures, and ETF’s. We use a combination of cycle, trend and momentum chart studies, on multiple timeframes, to present a “sum of the evidence” directional outlook in time and price.
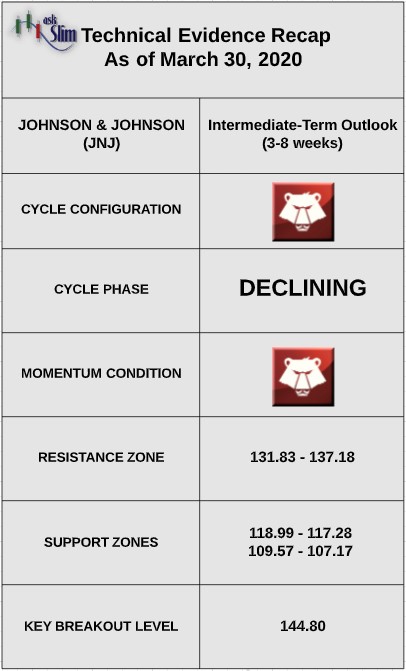
askSlim.com Technical Briefing: The weekly cycle analysis suggests that JNJ is in a declining phase. The next projected intermediate-term low is due between early July and early August. Weekly momentum is negative.
On the upside, there is an intermediate-term Fibonacci resistance zone from 131.83 – 137.18. On the downside, there is a Fibonacci support zone from 118.99 – 117.28 followed by another zone of support from 109.57 – 107.17. Our analysis suggests that for the bulls to regain control of the intermediate-term, we would likely need to see a weekly close above 144.80.
askSlim.com Sum of the Evidence: JNJ is in a declining phase with negative momentum. Given these conditions, we would expect any rallies in the near-term to be limited to the weekly resistance zone beginning at 131.83. There is a likelihood that the stock tests the lower Fibonacci support zone beginning at 109.57 by early August.
Interested in askSlim.com?
Get professional grade technical analysis, trader education and trade planning tools at askSlim.com. Write to matt@askslim.com for special askSlim membership trial offers!

