
Please note: we have an active Trade Idea in ATVI. Become a Level 3 or 4 member to get access to all of our Trade Ideas
This morning, Morgan Stanley raised their price target on Activision Blizzard (ATVI) from $76 to $80 while maintaining an overweight rating on the stock. In this blog post, we will review our multi-timeframe analysis on ATVI.
Activision Blizzard (ATVI) Weekly Chart – annotations by askSlim.com
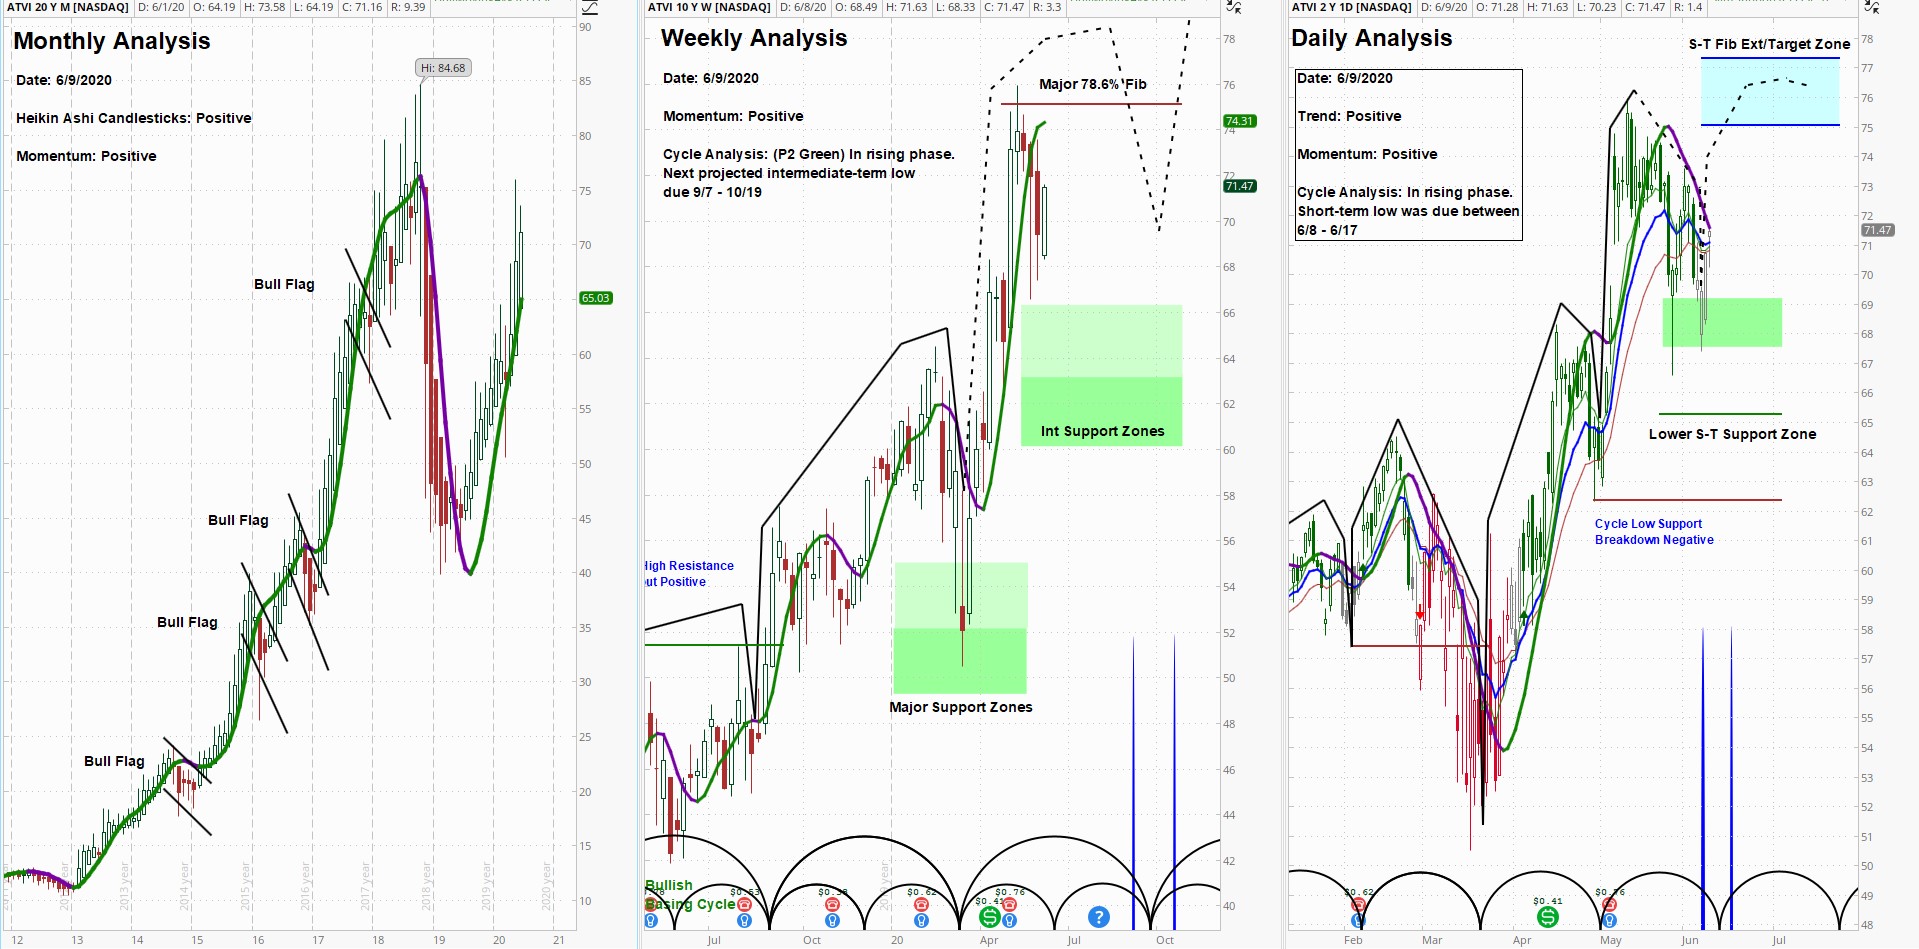
At askSlim.com we use technical analysis to evaluate price charts of stocks, futures, and ETF’s. We use a combination of cycle, trend and momentum chart studies, on multiple timeframes, to present a “sum of the evidence” directional outlook in time and price.
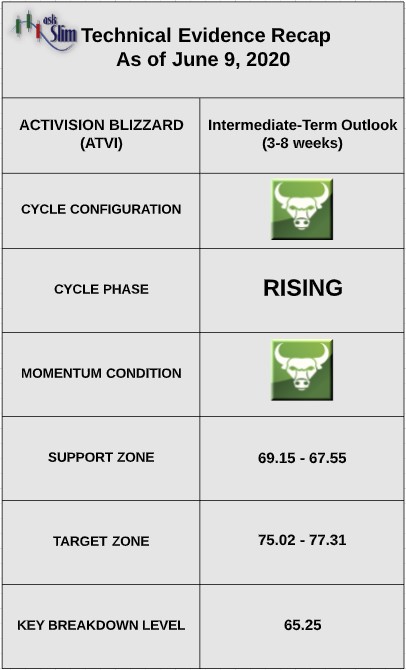
askSlim.com Technical Briefing: ATVI’s monthly momentum is firmly positive. The weekly cycle analysis suggests that ATVI is in an intermediate-term rising phase. The next projected intermediate-term low is due between early September and the middle of October. The daily cycle analysis suggests that ATVI has just formed a short-term low and is now in a rising phase.
On the upside, there is a Fibonacci extension zone from 75.02 – 77.31. On the downside, there is a short-term support zone from 69.15 – 67.55. For the bears to gain control of the short-term, we would need to see a close below 65.25.
askSlim.com Sum of the Evidence: ATVI is in a bullish condition across the monthly, weekly and daily timeframes. There is a likelihood that the stock tests the short-term Fibonacci extension zone beginning at 75 by the end of July.
Interested in askSlim.com?
Get professional grade technical analysis, trader education and trade planning tools at askSlim.com. Write to matt@askslim.com for special askSlim membership trial offers!

