
NVIDIA (NVDA) announced they have secured China’s approval for its $6.9B buyout of Mellanox (MLNX). NVDA rose almost 5% on the trading day. Given this news, let’s see what the charts tell us.
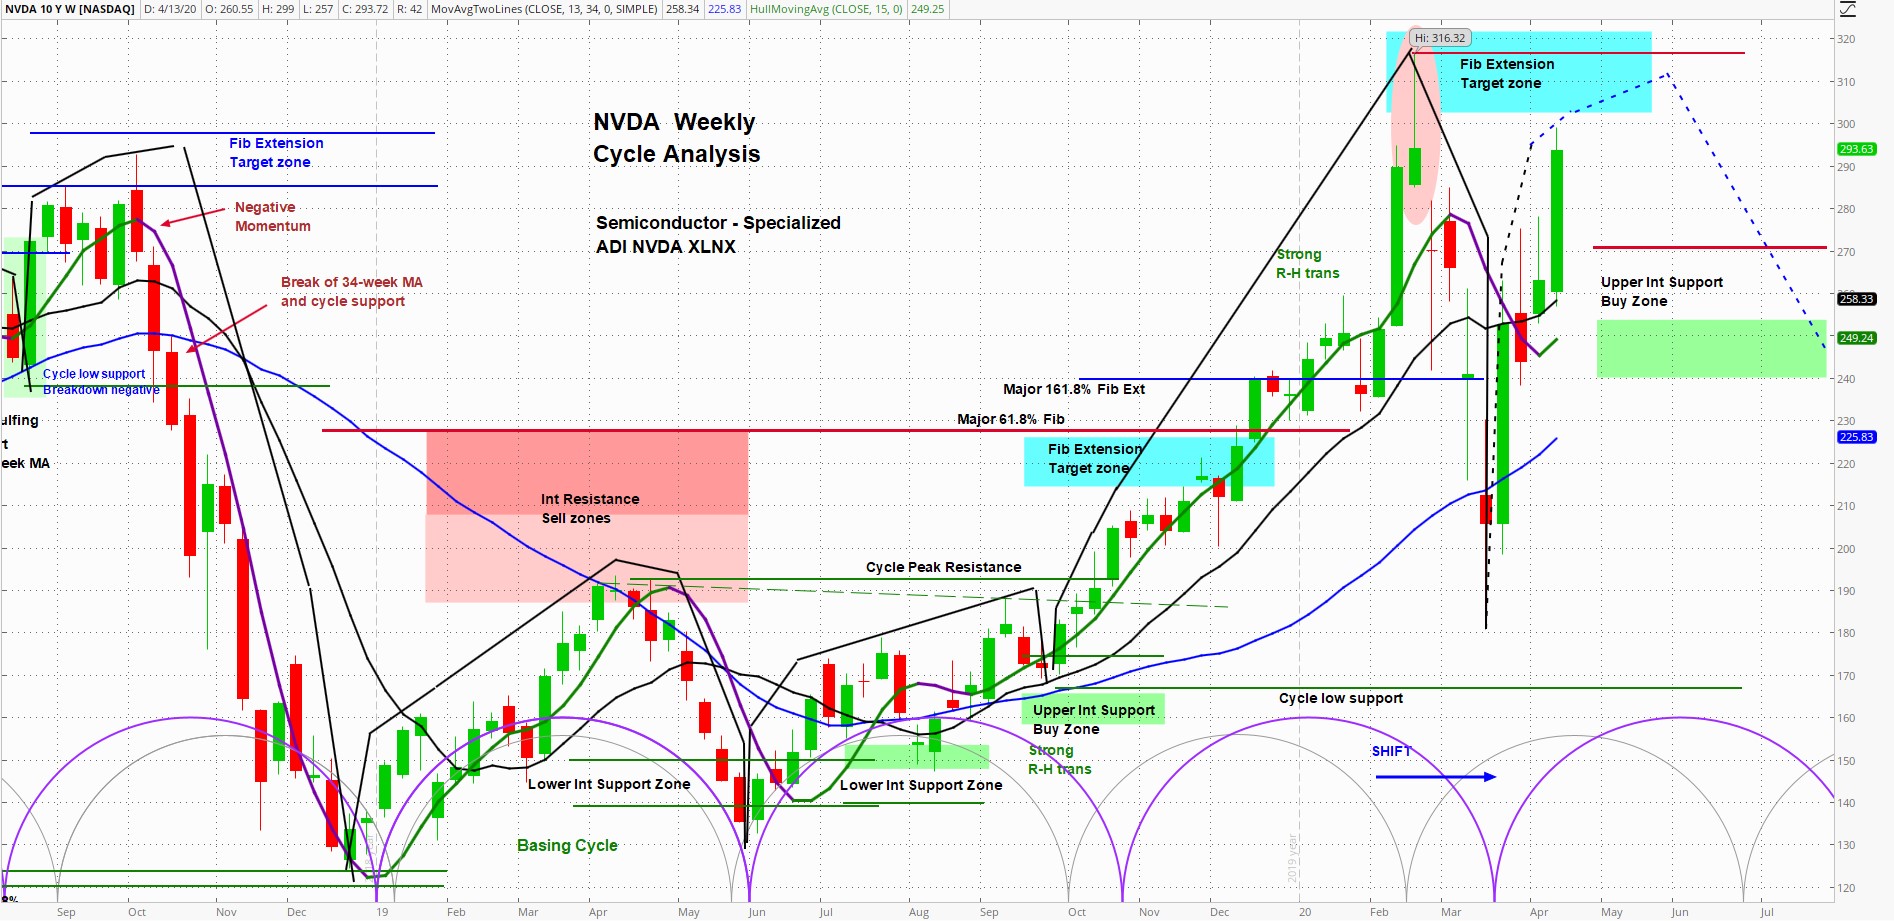
NVIDIA (NVDA) Weekly Chart – annotations by askSlim.com
At askSlim.com we use technical analysis to evaluate price charts of stocks, futures, and ETF’s. We use a combination of cycle, trend and momentum chart studies, on multiple timeframes, to present a “sum of the evidence” directional outlook in time and price.
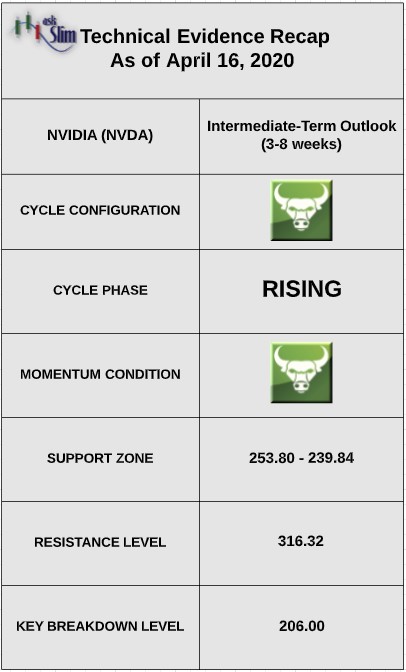
askSlim.com Technical Briefing: The weekly cycle analysis suggests that the stock is in a rising phase. The next projected intermediate-term low is due in the middle of August. Weekly momentum is positive.
On the upside, the only visible resistance is the all-time-high at 316.32. On the downside, the stock has rising intermediate-term Fibonacci supports from 253.80 – 239.84. For the bears to regain control of the intermediate-term, we would likely need to see a close below 206.00.
askSlim.com Sum of the Evidence: NVDA is in a rising phase with positive weekly momentum. The stock is approaching its prior all time high and is likely to encounter some resistance. There is a likelihood that the stock tests the intermediate-term supports beginning at 254 by June.
Interested in askSlim.com?
Get professional grade technical analysis, trader education and trade planning tools at askSlim.com. Write to matt@askslim.com for special askSlim membership trial offers!

