
PulteGroup (PHM) reported Q4 2019 earnings on 1/27/2020. The company reported adjusted EPS of $1.14, which beat consensus estimates of $1.08. Revenues came in at $3.02B, which also beat consensus estimates of $2.97B. PHM reported a 33% increase in net new orders. The company’s CEO, Ryan Marshall, attributes the increase in net new orders in part due to low unemployment, low mortgages rates and a balanced inventory of homes. Let’s see what the charts tell us.
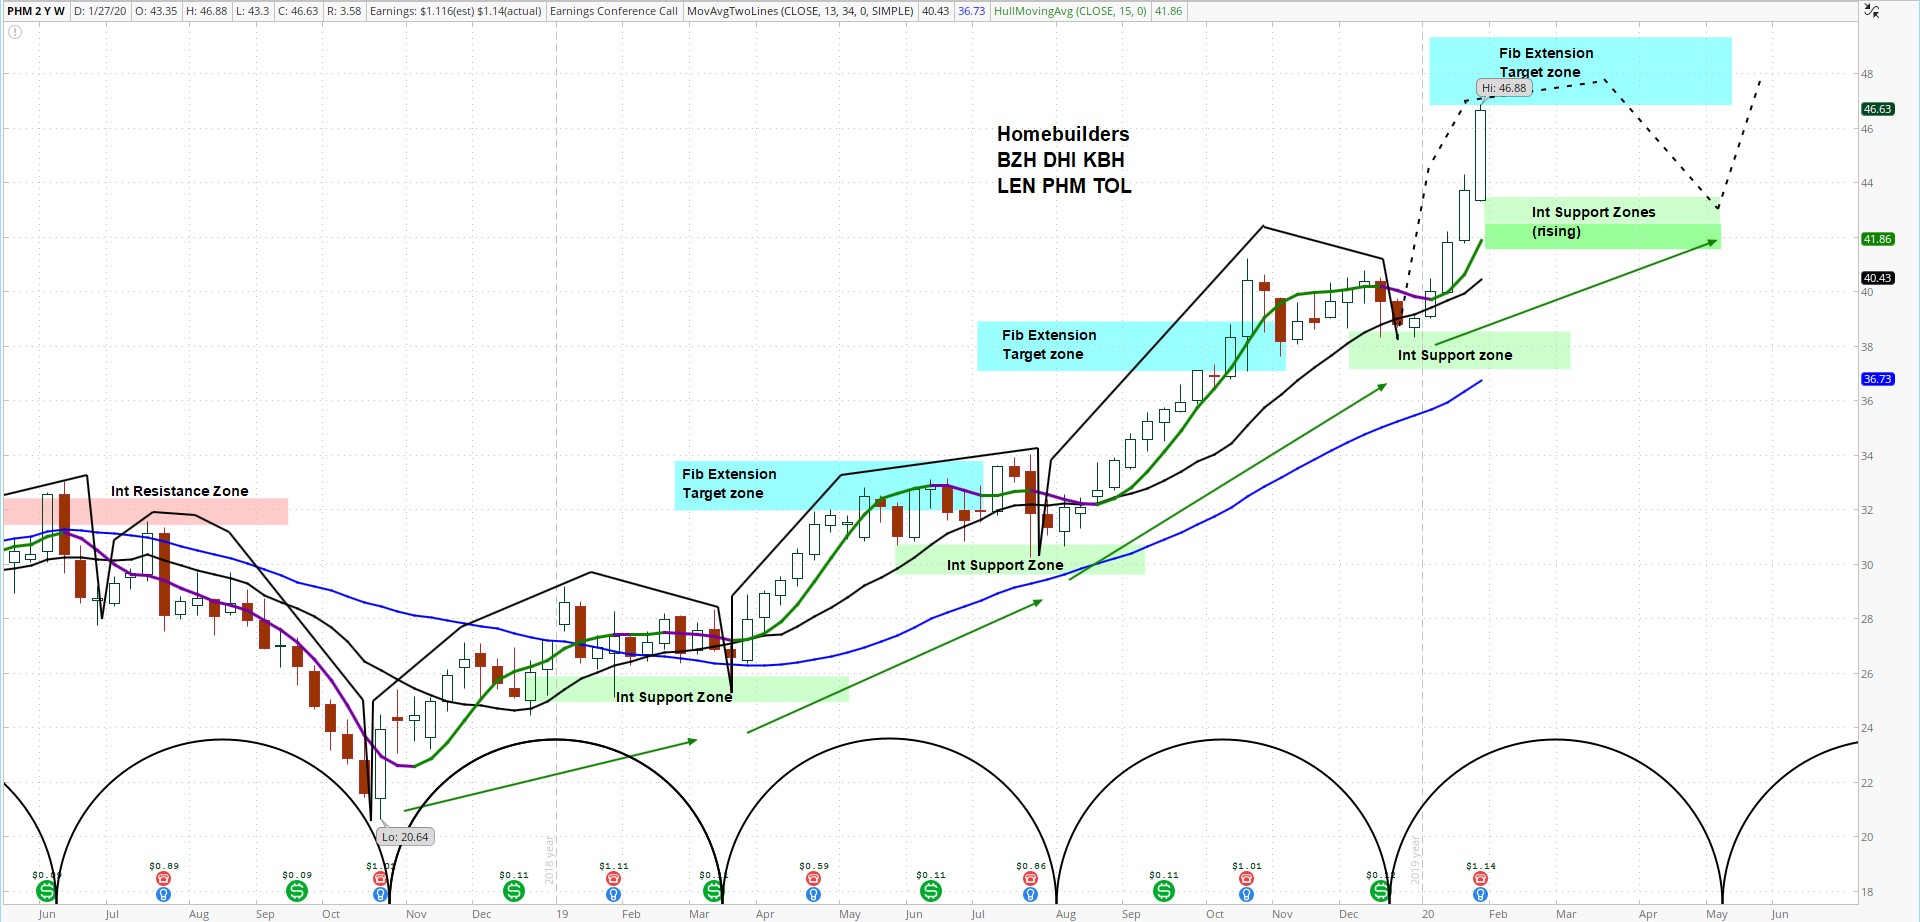
PulteGroup (PHM) Weekly Chart – annotations by askSlim.com
At askSlim.com we use technical analysis to evaluate price charts of stocks, futures, and ETF’s. We use a combination of cycle, trend and momentum chart studies, on multiple timeframes, to present a “sum of the evidence” directional outlook in time and price.
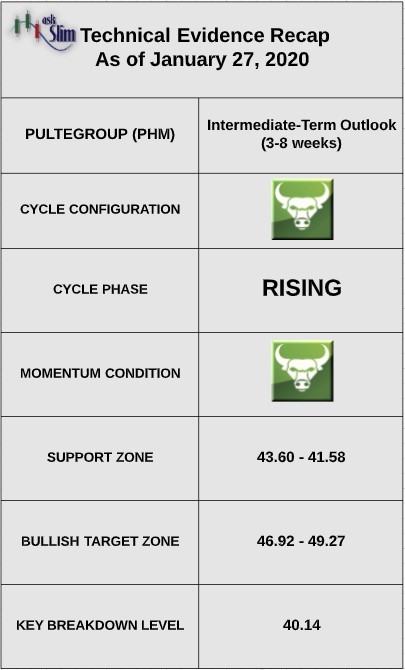
askSlim.com Technical Briefing: PHM has a very bullish intermediate-term cycle configuration and positive weekly momentum. These conditions will likely to limit any downside in the stock to the rising intermediate-term Fibonacci supports between 43.60 – 41.58.
On the upside, there is an intermediate-term Fibonacci projection/target zone from 46.92 – 49.27. On the downside, there are rising intermediate-term Fibonacci support zones from 43.60 – 41.58. Our analysis suggests that for the bears to regain control of the intermediate-term, we would likely need to see a weekly close below 40.14.
askSlim.com Sum of the Evidence: PHM has a very positive weekly cycle configuration that suggests that declines will be limited to the intermediate-term Fibonacci supports beginning at 43.60. The next projected intermediate-term low is due in May. Once the next intermediate-term low forms, there is a likelihood of the stock reaching 49 by July.
Interested in askSlim.com?
Get professional grade technical analysis, trader education and trade planning tools at askSlim.com. Write to matt@askslim.com for special askSlim membership trial offers!

