Hello, askSlim members!
A new Select Sector SPDR ETF Review has been posted reflective of market data as of 7/10/20. Comments and questions can be posted below. Enjoy!
The Select Sector SPDR ETF Review is designed to provide active traders and investors with a broad technical picture of key sectors of the S&P 500 including the XLE (Energy), XLF (Financials), XLI (Industrials), XLK (Technology) and XLP (Consumer Staples) sectors that will feature Slim’s Annotated Daily and Weekly charts and key actionable technical insights. Furthermore you will be able to compare the relative performance of the S&P 500 against all eleven Select SPDR ETFs at multiple timeframes with our proprietary momentum performance tracker.

XLE (ENERGY)
Slim's Annotated XLE Charts
XLE Weekly Chart

XLE Daily Chart

XLE Technical Overview
| SYMBOL |
|
LONG-TERM
TREND CONDITION |
LONG-TERM MOMENTUM (MONTHLY CHART) |
INTERMEDIATE
TREND CONDITION |
INTERMEDIATE MOMENTUM (WEEKLY CHART) |
SHORT-TERM TREND CONDITION |
SHORT-TERM MOMENTUM (DAILY CHART) |
|
Projected Date & Range for Cycle Low
(Weekly Chart) |
Projected Date & Range for Cycle Low
(Daily Chart) |
| XLE |
|
 |
|
 |
|
|
|
|
8/30/20
8/20-9/10
minor cycle
8/30/20 |
7/720
7/4-7/10 |
Technical Notes – Updated as of 7/10/20 @35.54
Upside Overview
- XLE technical conditions at multiple timeframes remain negative.
- XLE has a key minor resistance zone from 36.28-37.55
- XLE has a short-term resistance zone from 38.05-39.00
- XLE has a key short-term resistance zone from 40.11-42.02
- A close above 44.15 would likely be needed to shift the short-term trend condition back to positive.
- For the bulls to regain control of the intermediate-term bias a close above 54 would likely be needed.
Downside Overview
- XLE found buyers in the low-end of an indicated intermediate support zone from 34.87-34.10
- On a break below 34.10 XLE has another intermediate support zone from 32.71-31.35
XLF (FINANCIALS)
Slim's Annotated XLF Charts
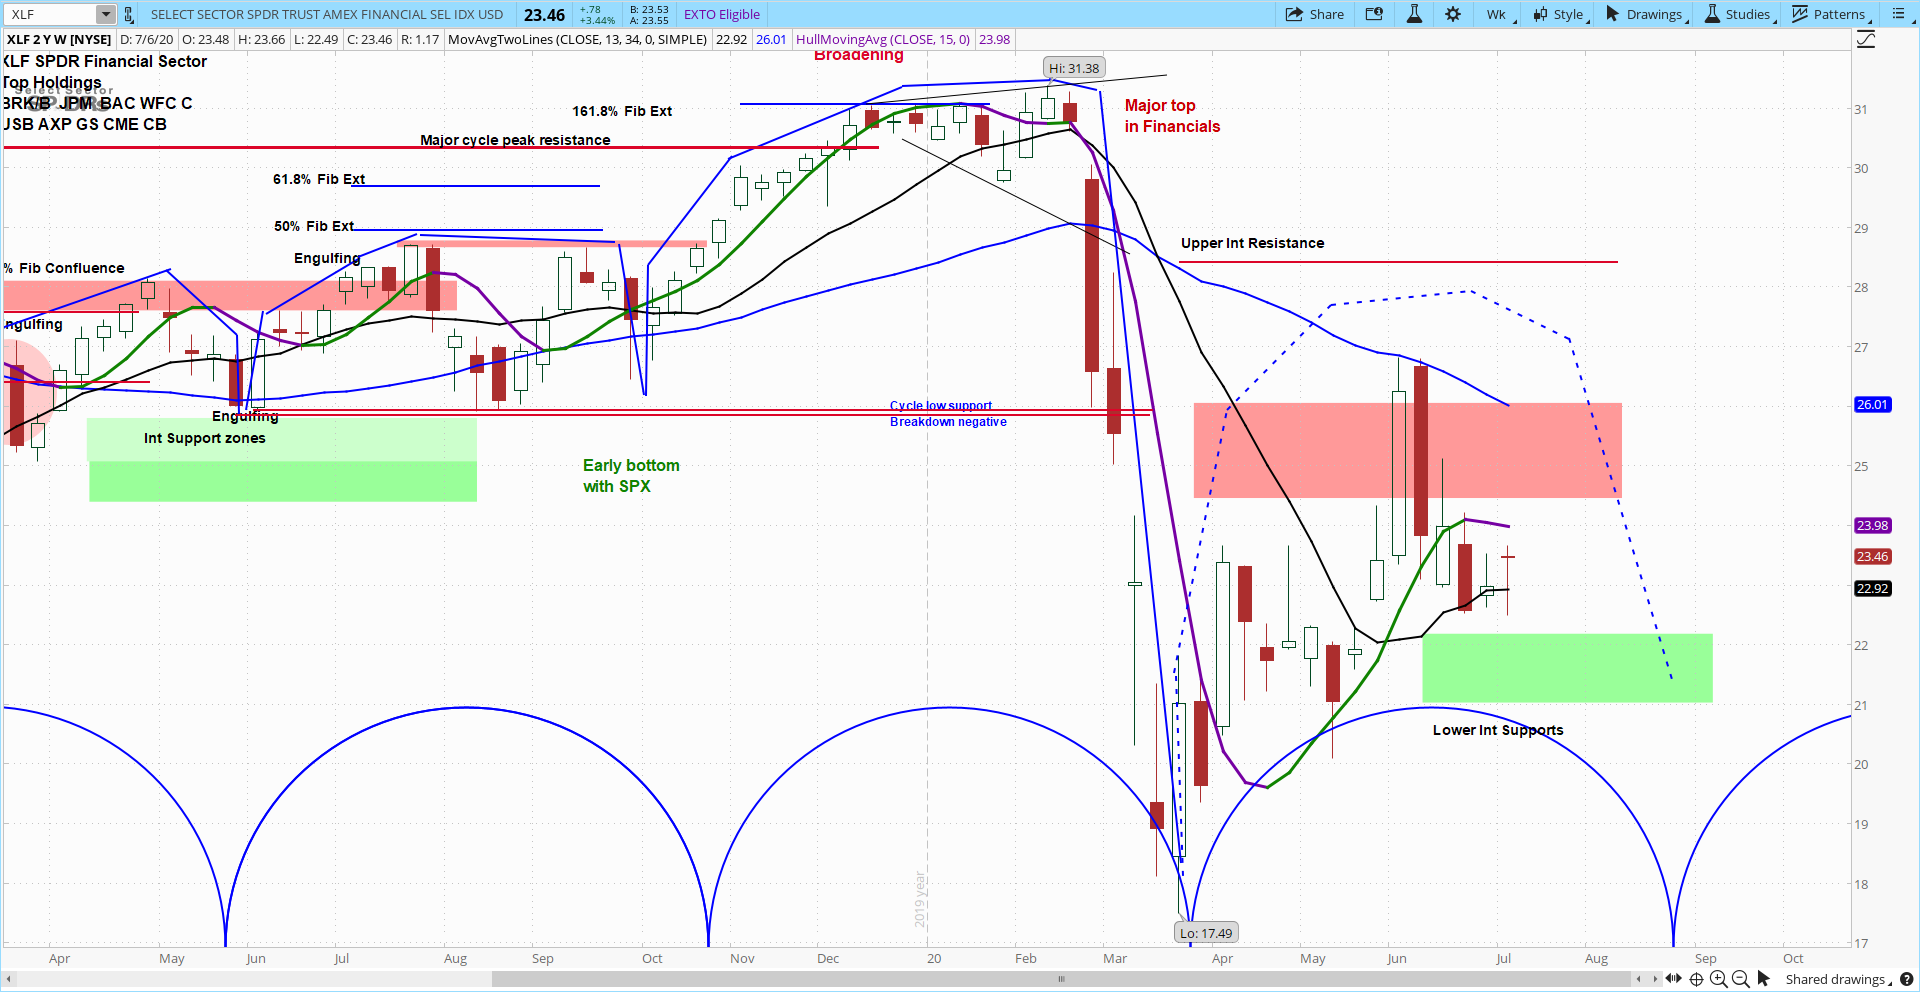
XLF Weekly Chart
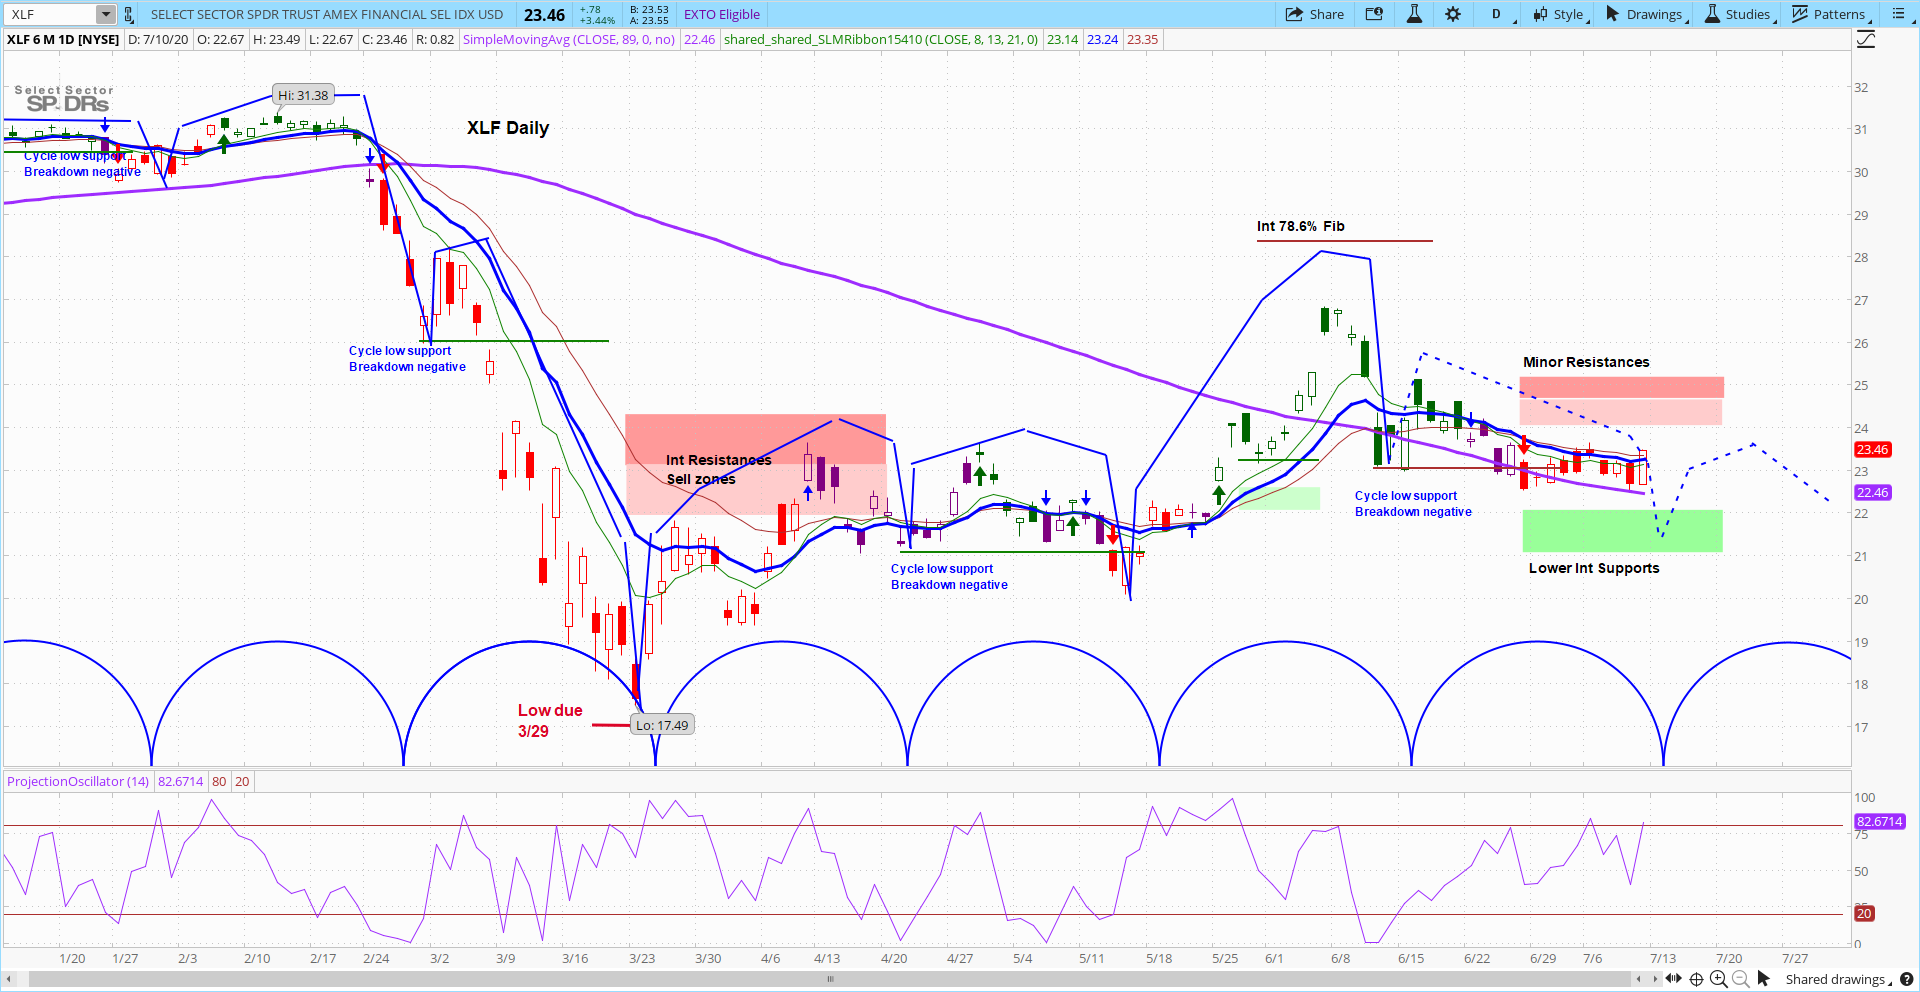
XLF Daily Chart
XLF Technical Overview
| SYMBOL |
|
LONG-TERM
TREND CONDITION |
LONG-TERM MOMENTUM (MONTHLY CHART) |
INTERMEDIATE
TREND CONDITION |
INTERMEDIATE MOMENTUM (WEEKLY CHART) |
SHORT-TERM TREND CONDITION |
SHORT-TERM MOMENTUM (DAILY CHART) |
|
Projected Date & Range for Cycle Low
(Weekly Chart) |
Projected Date & Range for Cycle Low
(Daily Chart) |
| XLF |
|
|
|
|
|
|
|
|
8/30/20
8/20-9/10 |
7/13/20
7/10-7/16/20
|
Technical Notes – Updated as of 7/10/20 at 23.46
Upside Overview
- XLF longer-term conditions remain bearish. Weekly technical conditions remain bearish, however, XLF has a bottom pending on the daily chart.
- XLF has a key short-term resistance zone from 24.20-24.75
- A close above 25.35 would likely shift the short-term trend condition back to positive and suggest XLF is on its way to challenge 26.00
- A breakout above 26.00 suggests XLF is on its way to challenge 26.96
Downside Overview
- XLF has a key minor support zone from 23-22.70
- XLF has a key intermediate support level at 22.17 and an initial intermediate support zone from 21.52-20.95
- A close below 21 will open the door to a test of key intermediate support from 19.50-17.49 (is the march low)
XLI (INDUSTRIALS)
Slim's Annotated XLI Charts
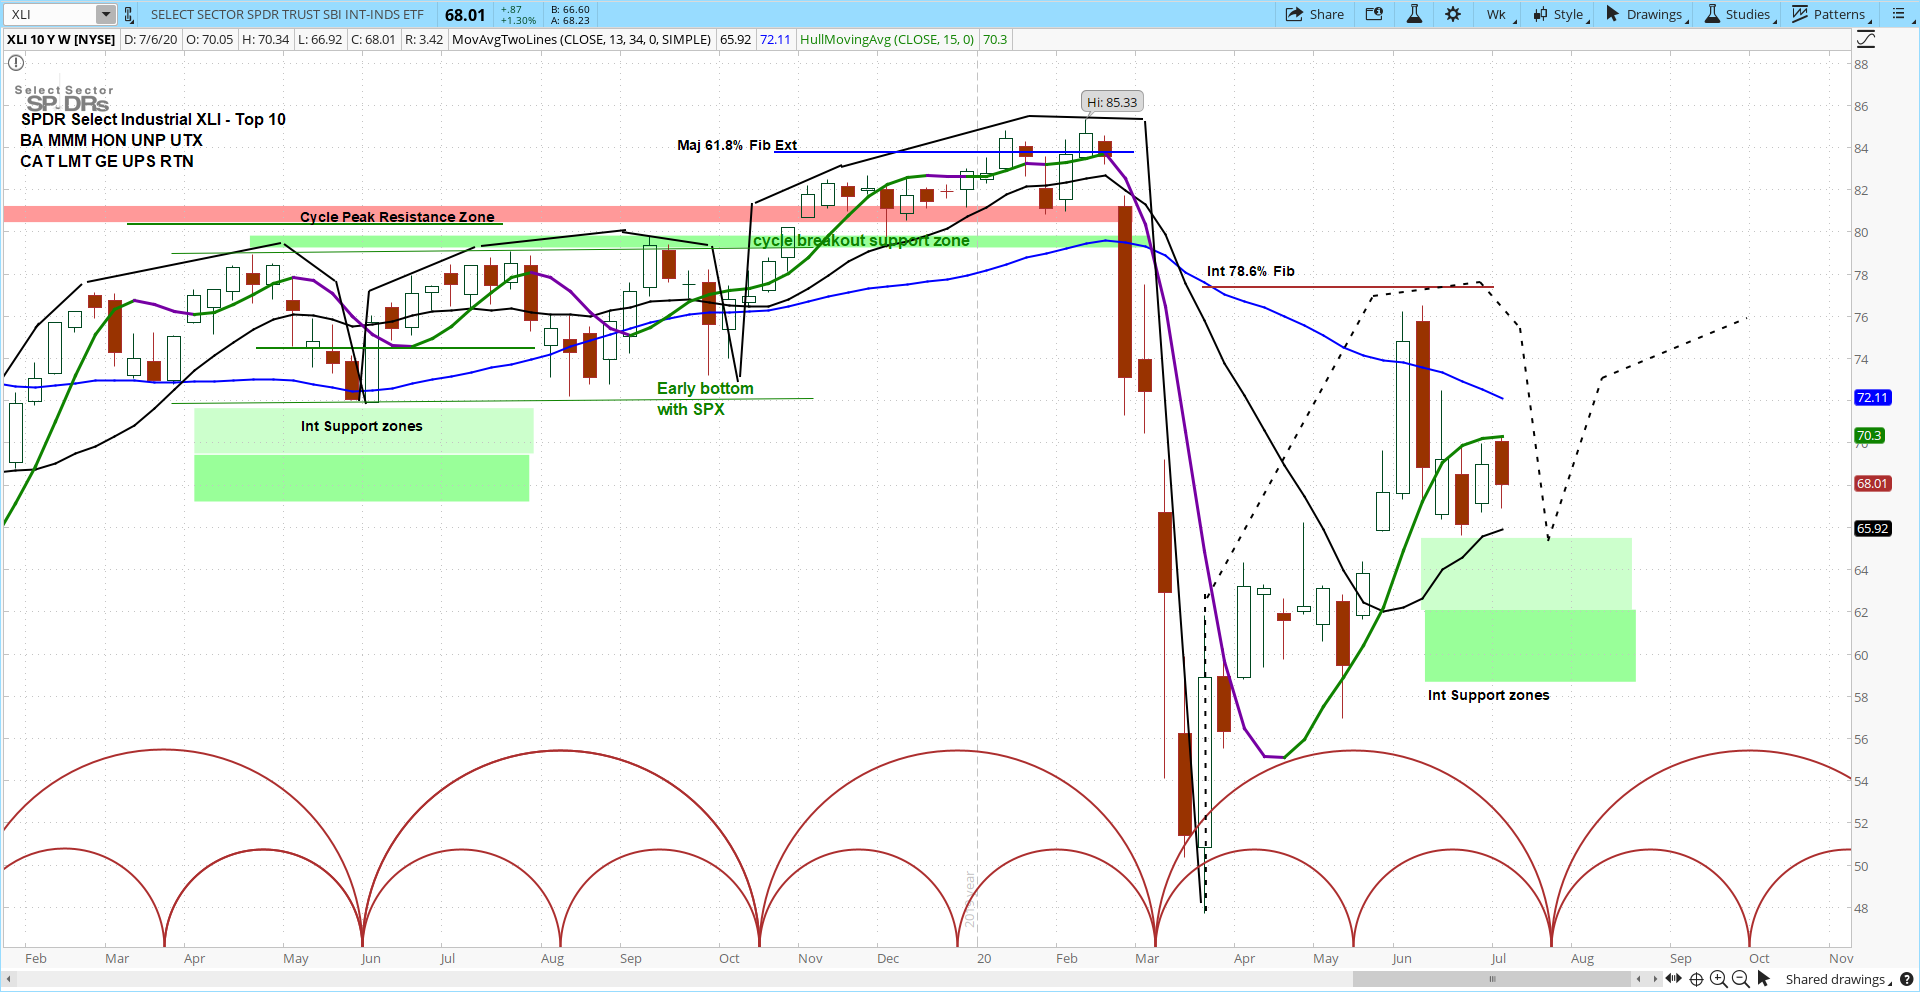
XLI Weekly Chart
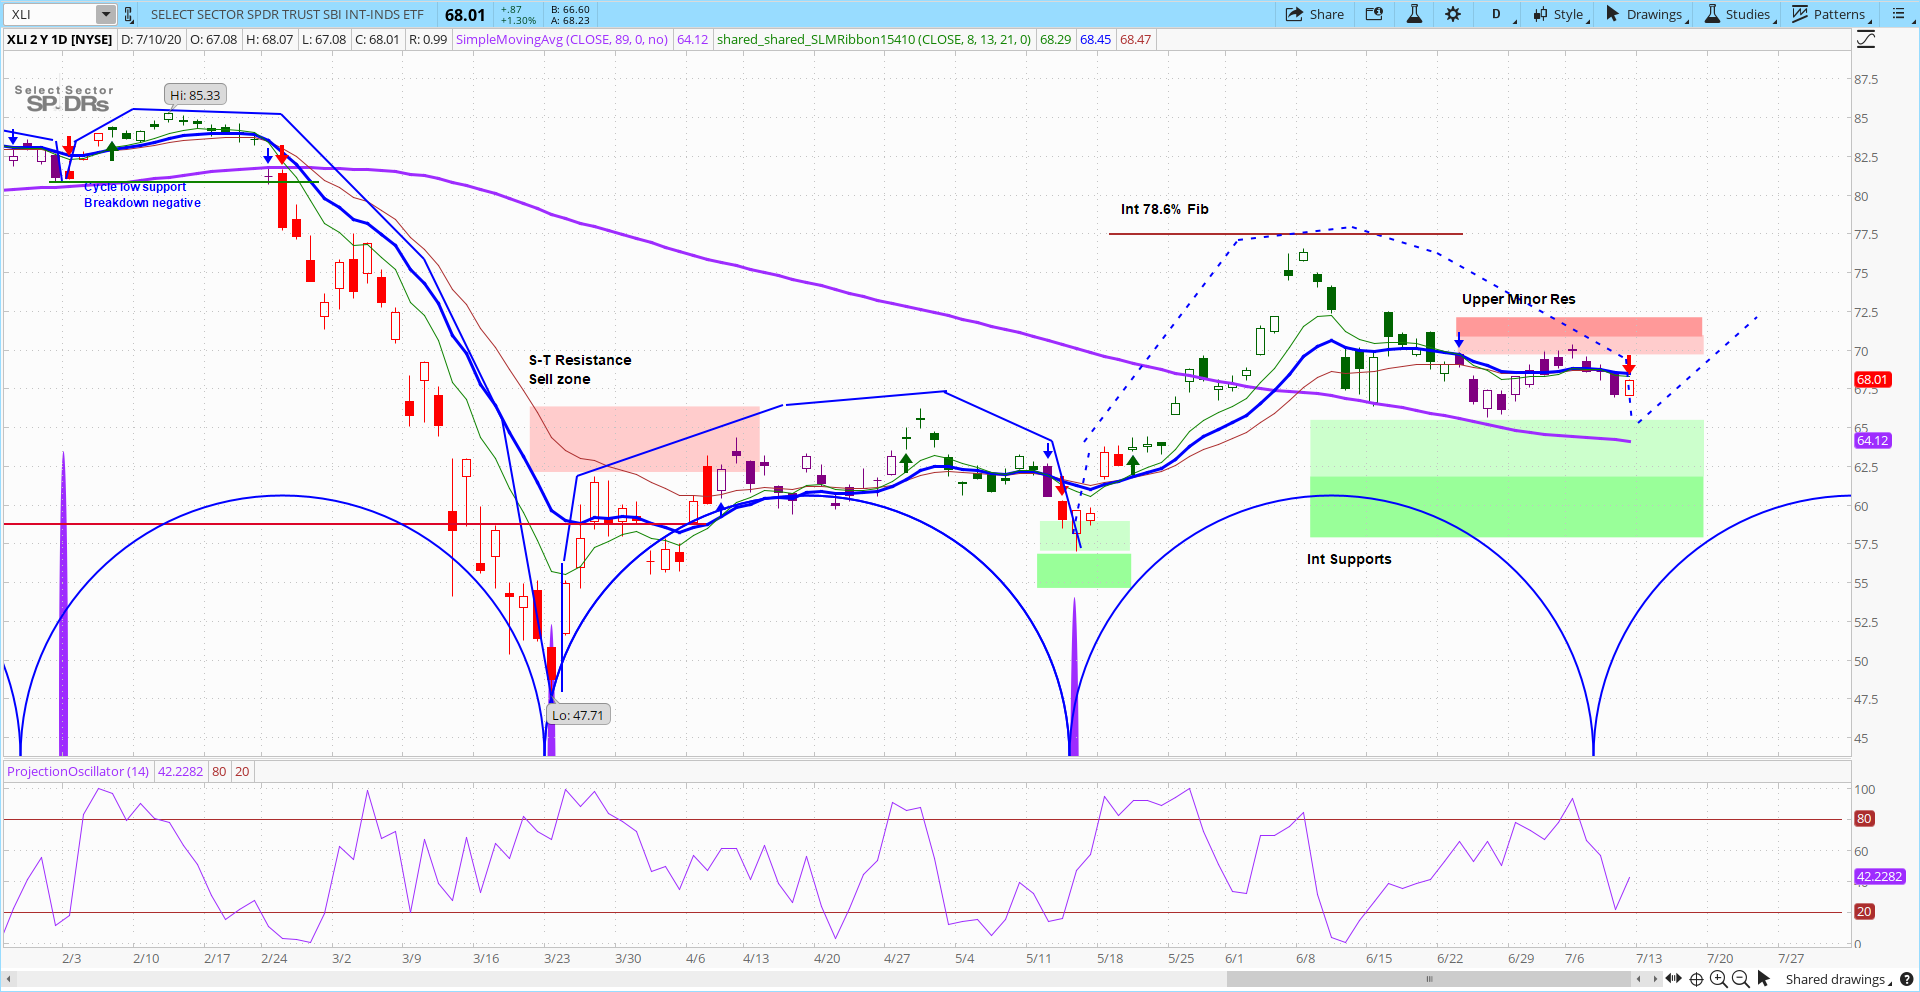
XLI Daily Chart
XLI Technical Overview
| SYMBOL |
|
LONG-TERM
TREND CONDITION |
LONG-TERM MOMENTUM (MONTHLY CHART) |
INTERMEDIATE
TREND CONDITION |
INTERMEDIATE MOMENTUM (WEEKLY CHART) |
SHORT-TERM TREND CONDITION |
SHORT-TERM MOMENTUM (DAILY CHART) |
|
Projected Date & Range for Cycle Low
(Weekly Chart) |
Projected Date & Range for Cycle Low
(Daily Chart) |
| XLI |
|
|
|
|
 |
|
|
|
7/26/20
7/16-8/5
minor cycle
7/26/20 |
7/6/20
7/3-7/9 |
Technical Notes – Updated as of 7/10/20 at 68.01
Upside Overview
- XLI longer-term conditions remain bearish while the intermediate and short-term conditions are mostly neutral.
- XLI has a key minor resistance zone from 68.65-69.62
- XLI has a key short-term resistance zone from 71.15-72.40
- A close above 72.40 would open the door to a challenge of 74.25 and a breakout above 74.25 would likely bring a challenge of the June recovery high at 76.53.
Downside Overview
- XLI found some buyers last week in a key short-term support zone from 67.75-66.50
- A break below 66.50 will open the door to a test of an initial intermediate support zone from 64.48-62.18
- A close below 64.45 is likely needed to shift the short-term technical condition neutral and would open the door to additional downside risk.
- Below 62.18 XLI has another intermediate support zone from 61.10-58.77
XLK (TECHNOLOGY)
Slim's Annotated XLK Charts
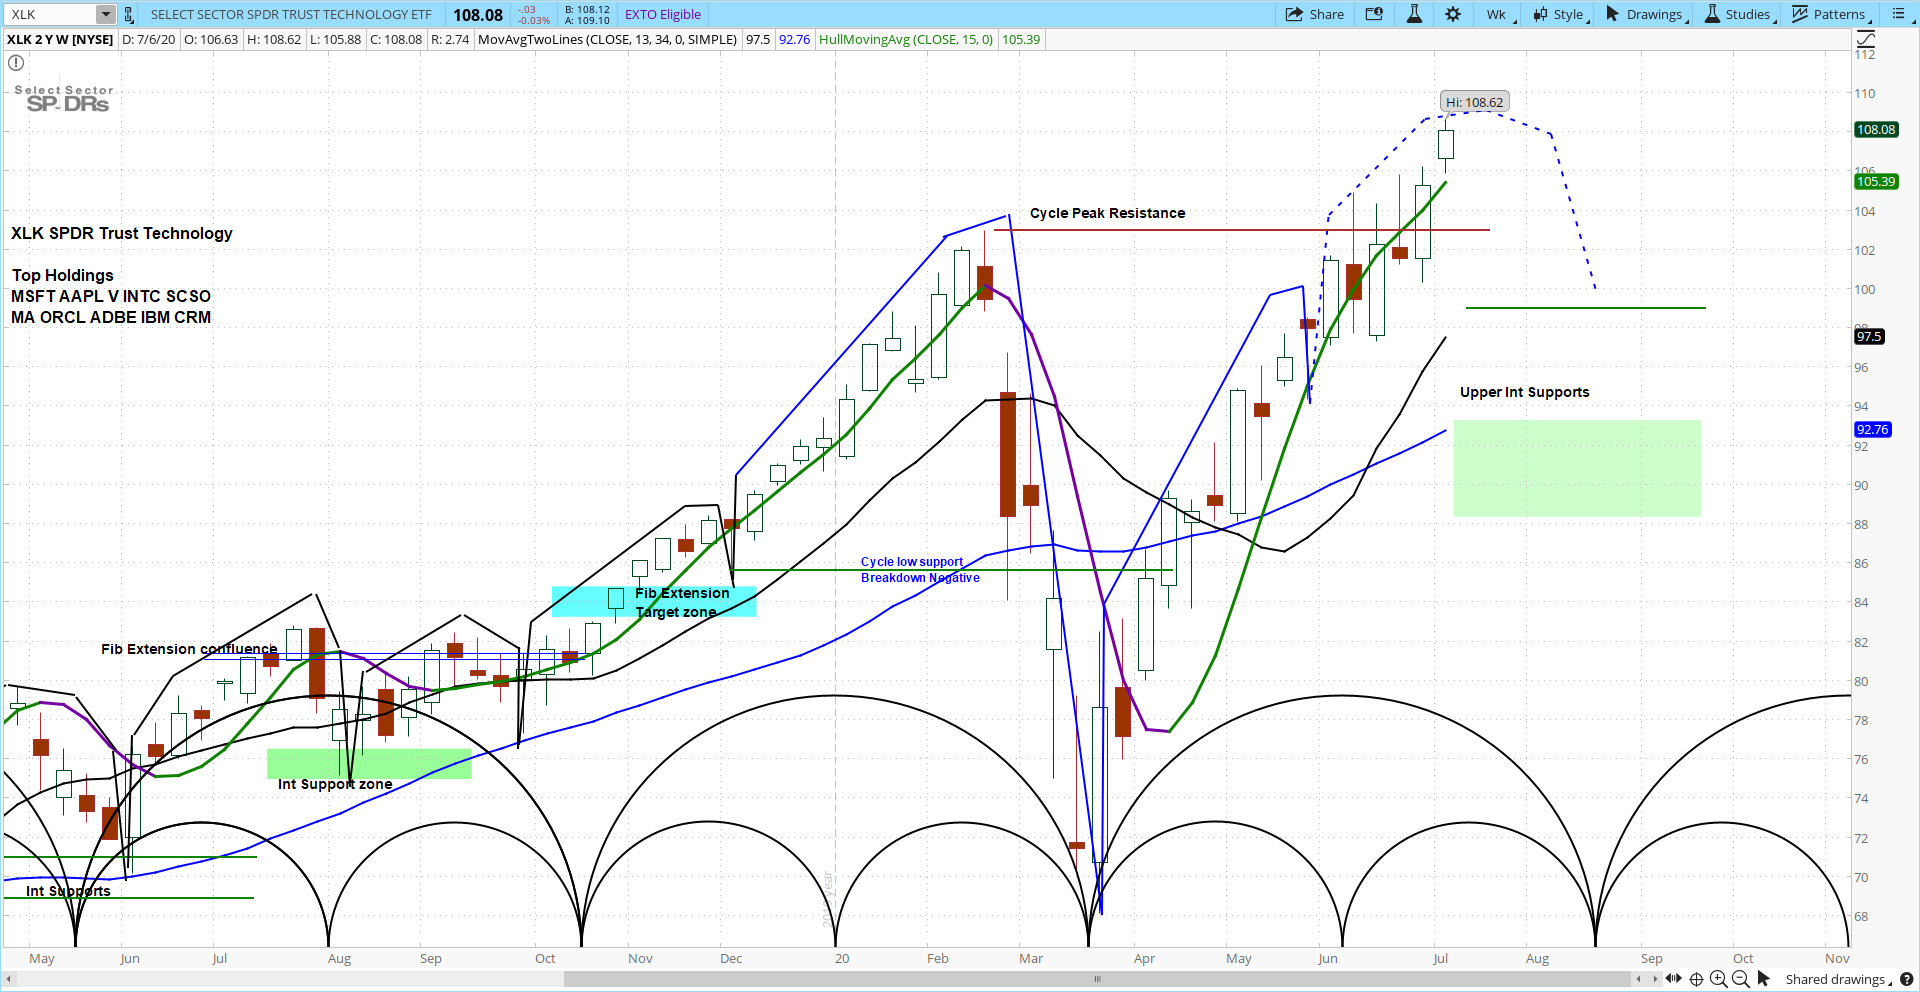
XLK Weekly Chart
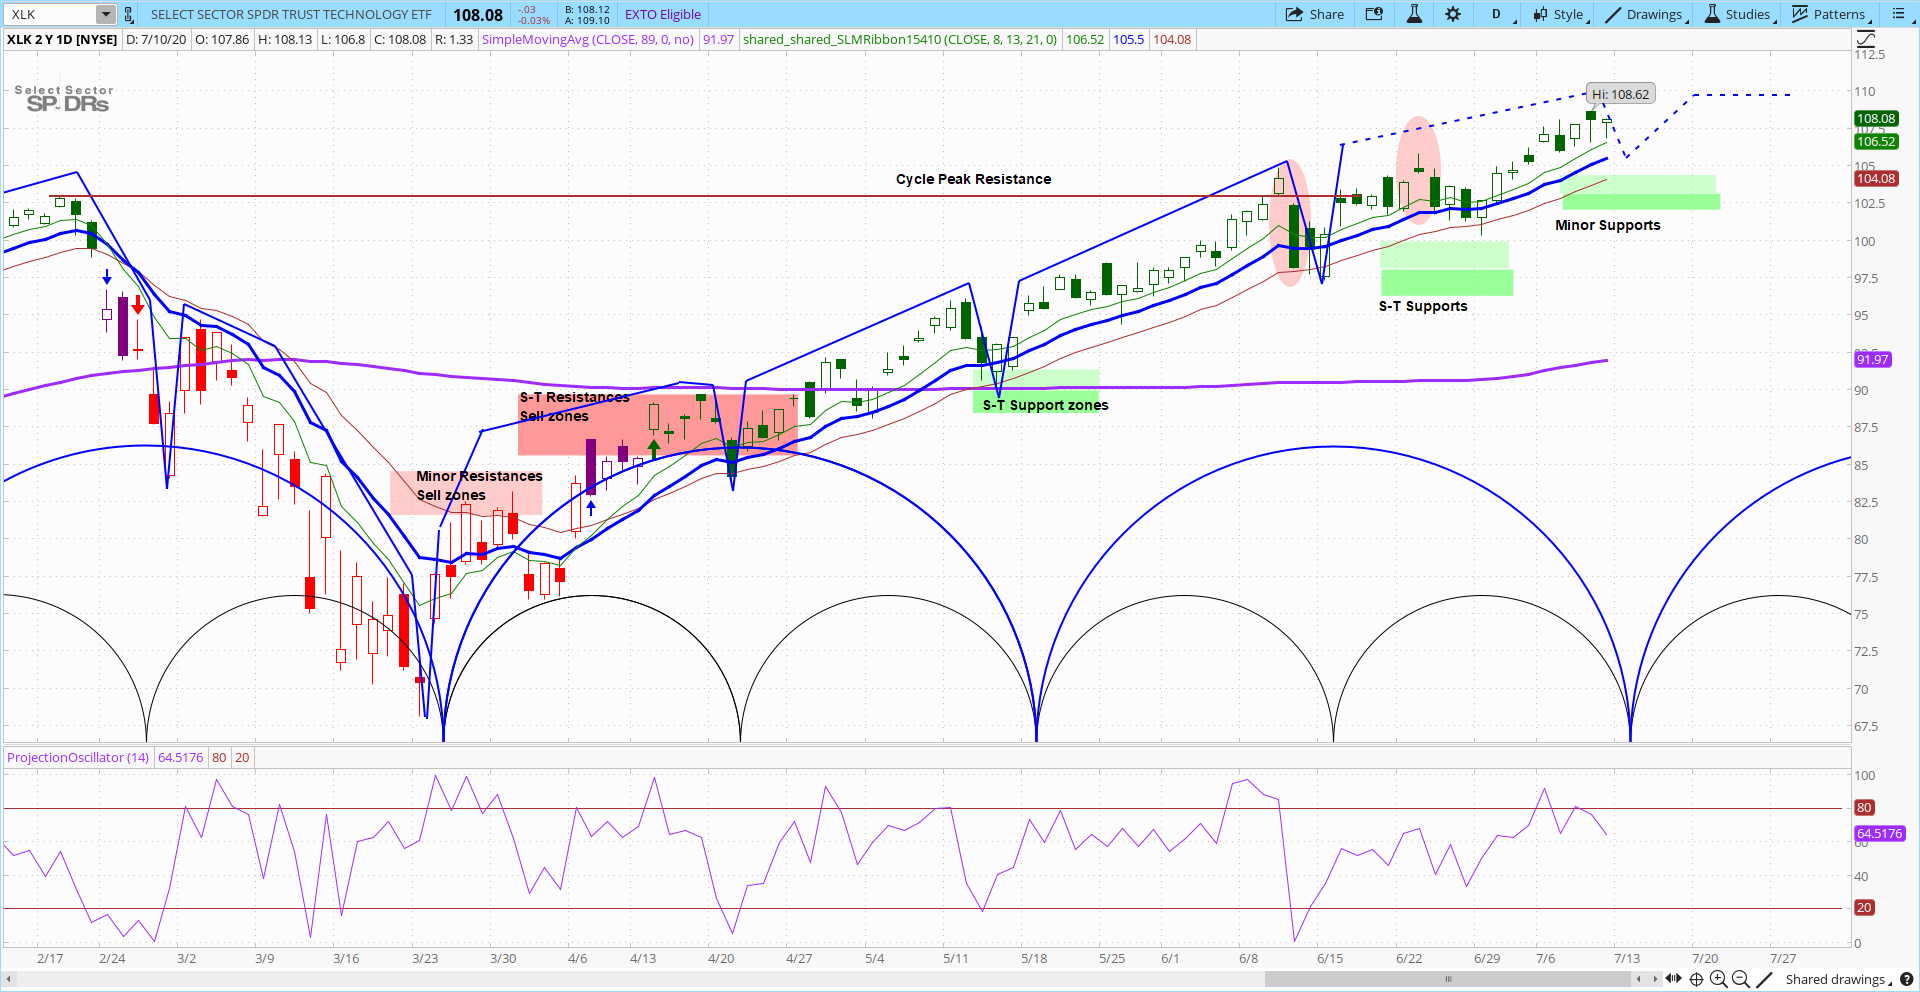
XLK Daily Chart
XLK Technical Overview
| SYMBOL |
|
LONG-TERM
TREND CONDITION |
LONG-TERM MOMENTUM (MONTHLY CHART) |
INTERMEDIATE
TREND CONDITION |
INTERMEDIATE MOMENTUM (WEEKLY CHART) |
SHORT-TERM TREND CONDITION |
SHORT-TERM MOMENTUM (DAILY CHART) |
|
Projected Date & Range for Cycle Low
(Weekly Chart) |
Projected Date & Range for Cycle Low
(Daily Chart) |
| XLK |
|
|
|
|
|
|
|
|
8/23/20
8/13-9/3
minor cycle
8/23/20 |
7/13/20
7/11-7/15
minor cycle
7/13/20
|
Technical Notes – Updated as of 7/10/20 at 108.08
Upside Overview
- XLK bullish technical condition remains firmly intact all time-frames, however, XLK is very extended relative to its 89 day SMA which suggests a short-term pullback is due.
- XLK printed another new all-time high last week at 108.62.
- Above 108.62 we are watching 109.57-111.19 as the next key short-term fib extension zone where a reversal could develop.
Downside Overview
- XLK has a key minor support zone from 106.15-105.21
- A close below 106 would open the door to a test of the short-term support zones from 104.50-102.95, then from 102.05-99.70
XLP (CONSUMER STAPLES)
Slim's Annotated XLP Charts
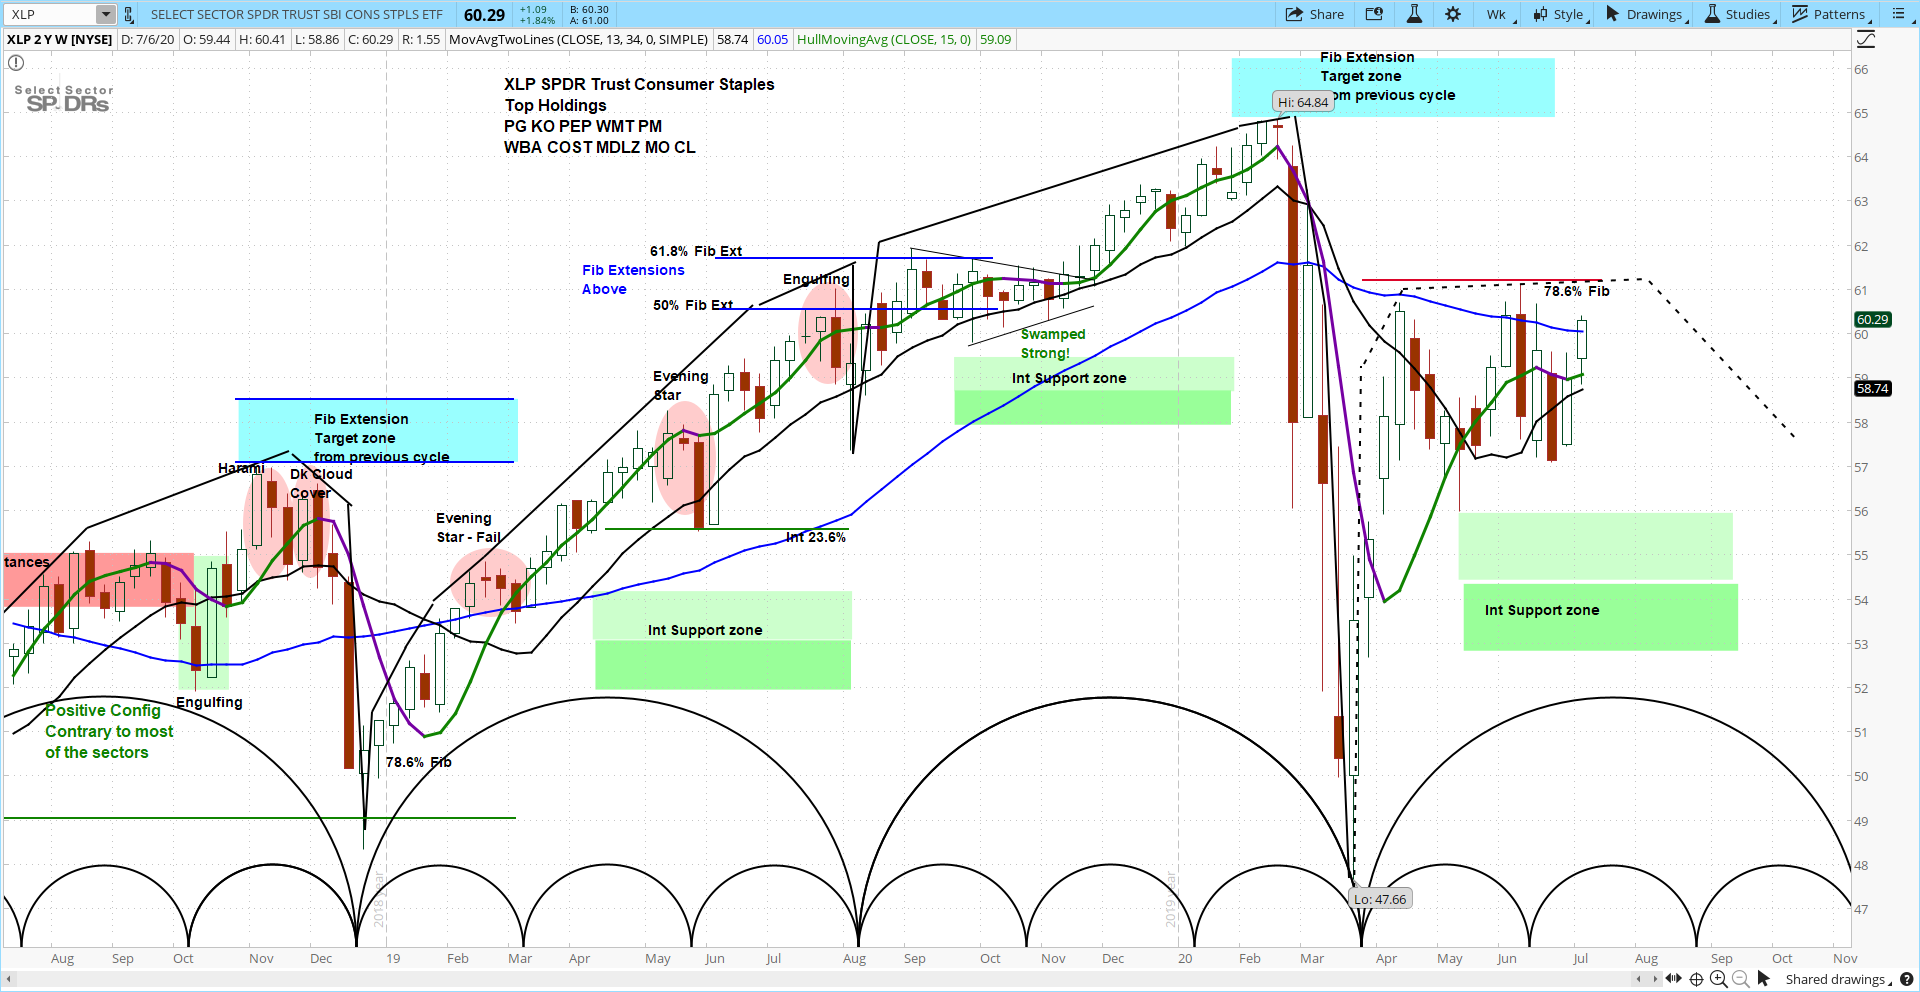
XLP Weekly Chart
XLP Daily Chart

Technical Overview
| SYMBOL |
|
LONG-TERM
TREND CONDITION |
LONG-TERM MOMENTUM (MONTHLY CHART) |
INTERMEDIATE
TREND CONDITION |
INTERMEDIATE MOMENTUM (WEEKLY CHART) |
SHORT-TERM TREND CONDITION |
SHORT-TERM MOMENTUM (DAILY CHART) |
|
Projected Date & Range for Cycle Low
(Weekly Chart) |
Projected Date & Range for Cycle Low
(Daily Chart) |
| XLP |
|
|
|
|
|
|
|
|
11/15/20
11/5-11/25/20
minor cycle
8/30/20
|
8/4/20
8/1-8/7/20
minor cycle
6/29/20
|
Technical Notes – Updated as of 7/10/20 at 60.29
Upside Overview
- XLP technical picture has improved, especially the intermediate and shorter term time-frames.
- XLP pushed above a key minor resistance zone from 58.40-59.30 and closed in the top-end of a key short-term resistance zone from 59.60-60.47
- The recent breakout above 60.25 has likely triggered a move to challenge the recent recovery high of 61.10.
- Above 61.10 we are watching 62.18, then 63.57-65.34 as the next key intermediate resistance/target zones.
- A close below 58.30 would likely be needed to negate the more bullish upside scenario.
Downside Overview
- XLP has key minor support zone from 59.64-59.19
- XLP has short-term support zone from 59.14-58.35
- A violation of 57.40 will open the door to a test of initial intermediate support zone from 55.95-54.36.
- XLP has a key I-T support zone from 52.80-50.52.
RELATIVE PERFORMANCE – ALL SECTOR SPDR ETFs
askSlim Trend & Momentum Tracker
HELPFUL TIPS:
- Click on the “down” arrow in front of each section to expand the content and click on the “up” arrow to collapse the content.
- Click on each chart image for the full-size render.
- New to Slim’s Charts? Click the following link to learn more. Slim’s Chart Training
- Click on the following link to learn more about Slim’s Trend Momentum Tracking Tool
DISCLAIMERS
Askslim.com, Inc. owns and operates the website known as: www.askslim.com. All of the information on www.askslim.com is solely for entertainment, informational and educational purposes only and is not investment or trading advice. None of the information on the Website or in emails is guaranteed to be accurate, complete, useful or timely.
Please go askslim.com for the full disclaimer, terms and conditions and privacy policy.


