
A new Chinese Coronavirus has infected more than 300 people and killed 6. There are concerns of the risk of a global outbreak similar to that of SARS in 2002-2003. This news sent WYNN Resorts (WYNN) down 6%. Let’s review the WYNN chart and see what it suggests.
WYNN Resorts (WYNN) Weekly Chart – annotations by askSlim.com

At askSlim.com we use technical analysis to evaluate price charts of stocks, futures, and ETF’s. We use a combination of cycle, trend and momentum chart studies, on multiple timeframes, to present a “sum of the evidence” directional outlook in time and price.
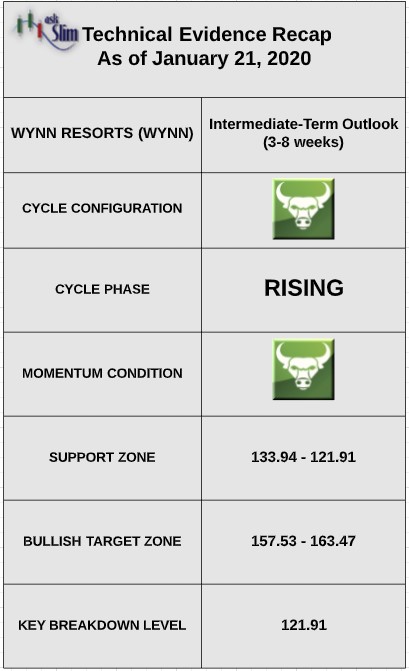
askSlim.com Technical Briefing: The positive cycle configuration and weekly momentum is likely to limit any downside in the stock to the intermediate-term Fibonacci supports between 133.94 – 121.91.
On the upside, there is an intermediate-term Fibonacci projection/target zone from 157.53 – 163.47. On the downside, there are intermediate-term Fibonacci support zones from 133.94 – 121.91. Our analysis suggests that for the bears to regain control of the intermediate-term, we would likely need to see a weekly close below 121.91.
askSlim.com Sum of the Evidence: WYNN has a positive weekly cycle configuration that suggests that declines will be within the context of an intermediate-term rising phase over the next several weeks with a likelihood of the stock reaching 157 by May.
Interested in askSlim.com?
Get professional grade technical analysis, trader education and trade planning tools at askSlim.com. Write to matt@askslim.com for special askSlim membership trial offers!

