S&P 500 Daily Snapshot Lite!
The Daily Snapshot Lite includes a comprehensive dive into the S&P 500’s technical conditions. Each report includes a taste of the premium insights we offer in our full Stock Index (SIR) Daily Snapshot Report. Please share your comments and feedback below. Enjoy!
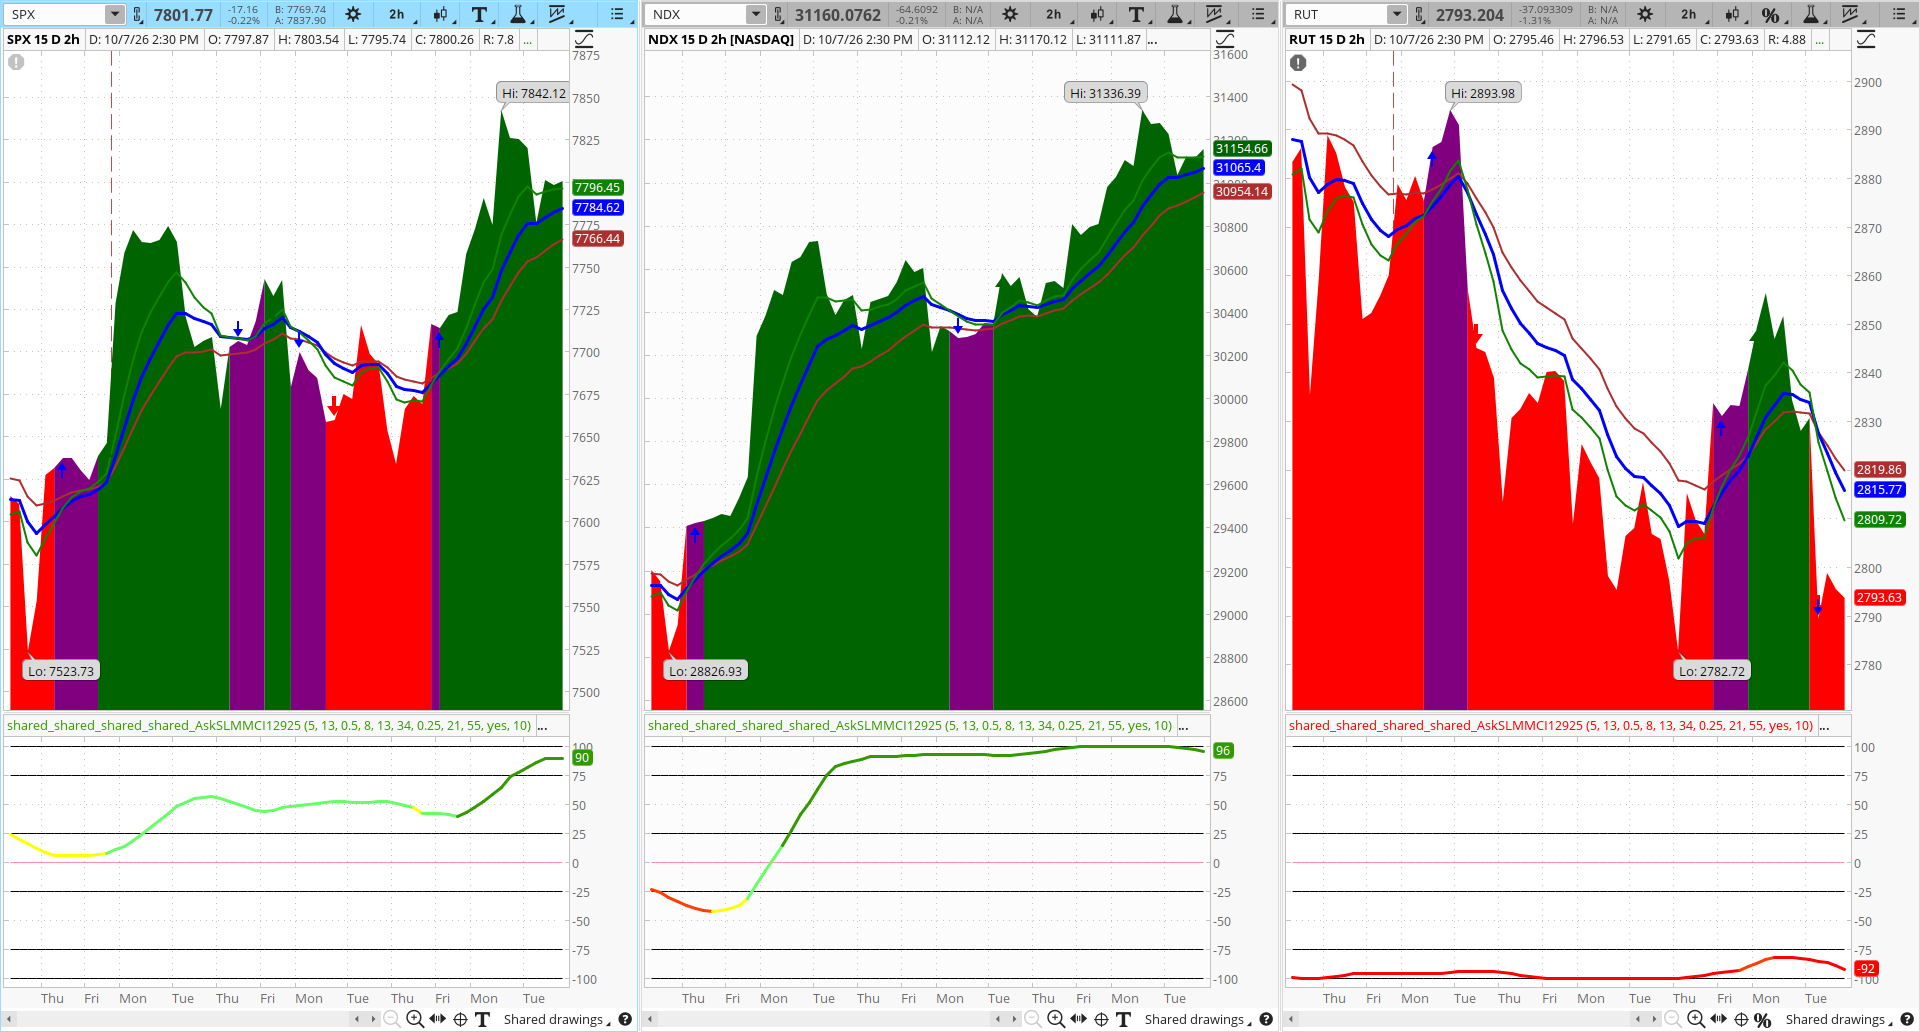
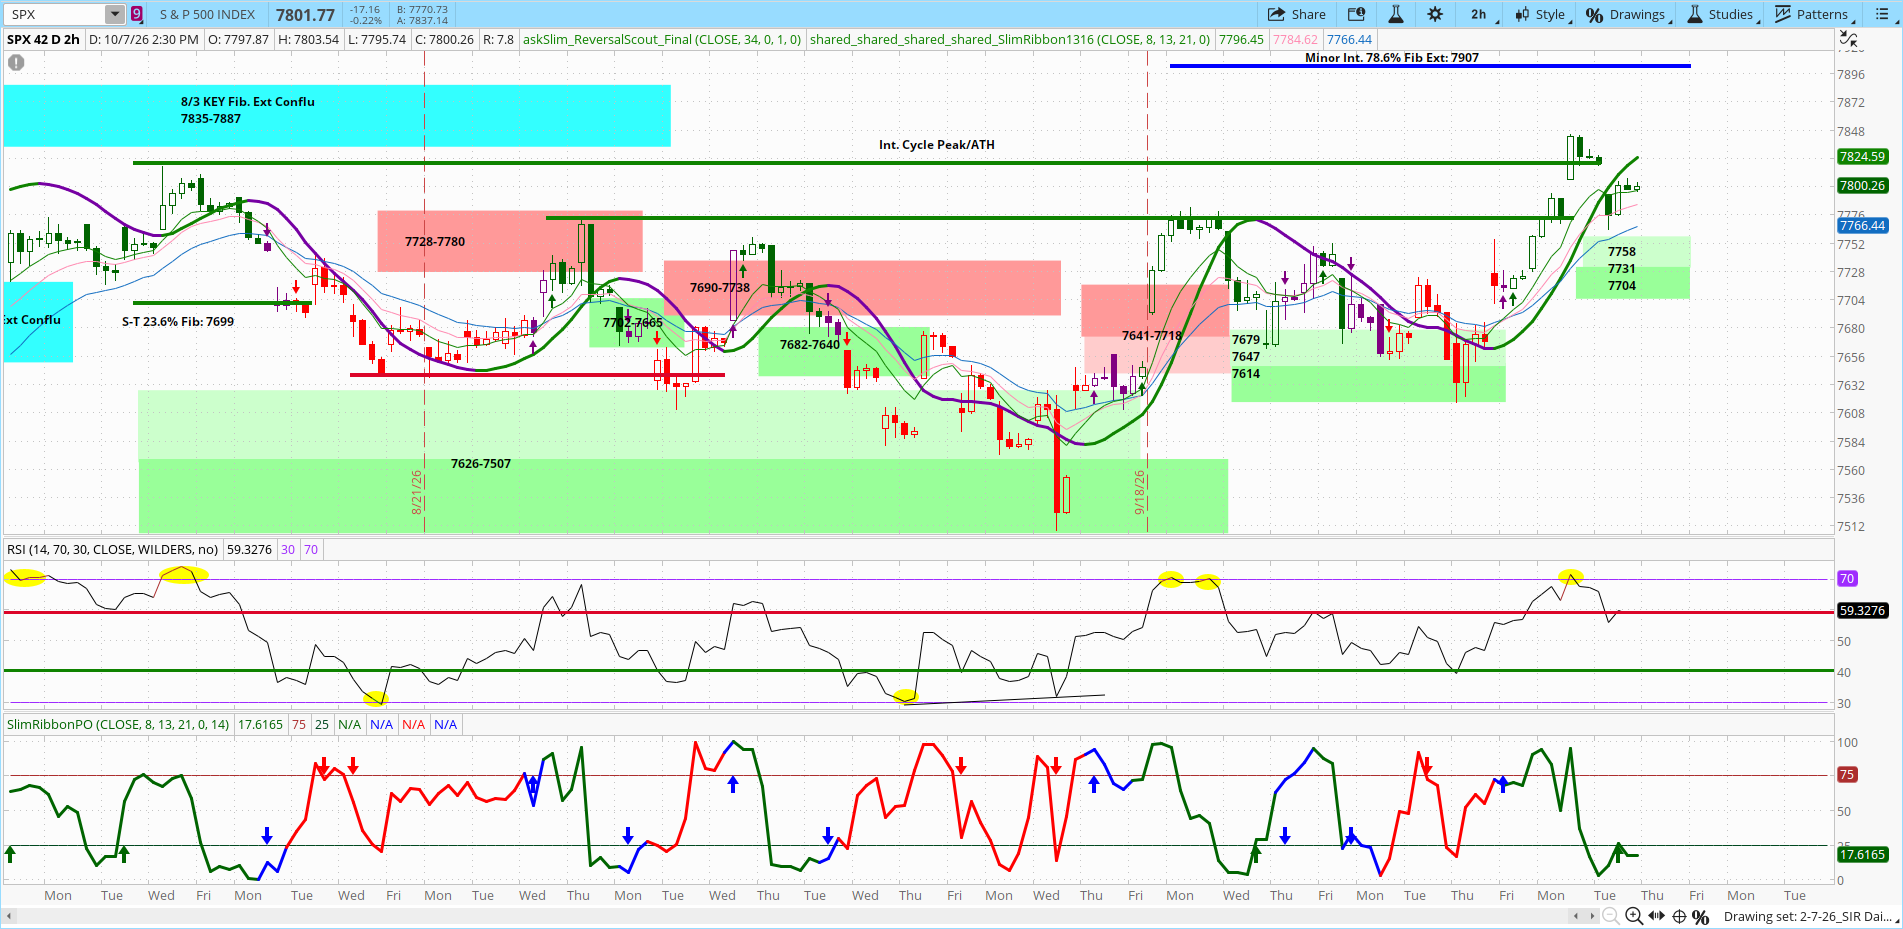
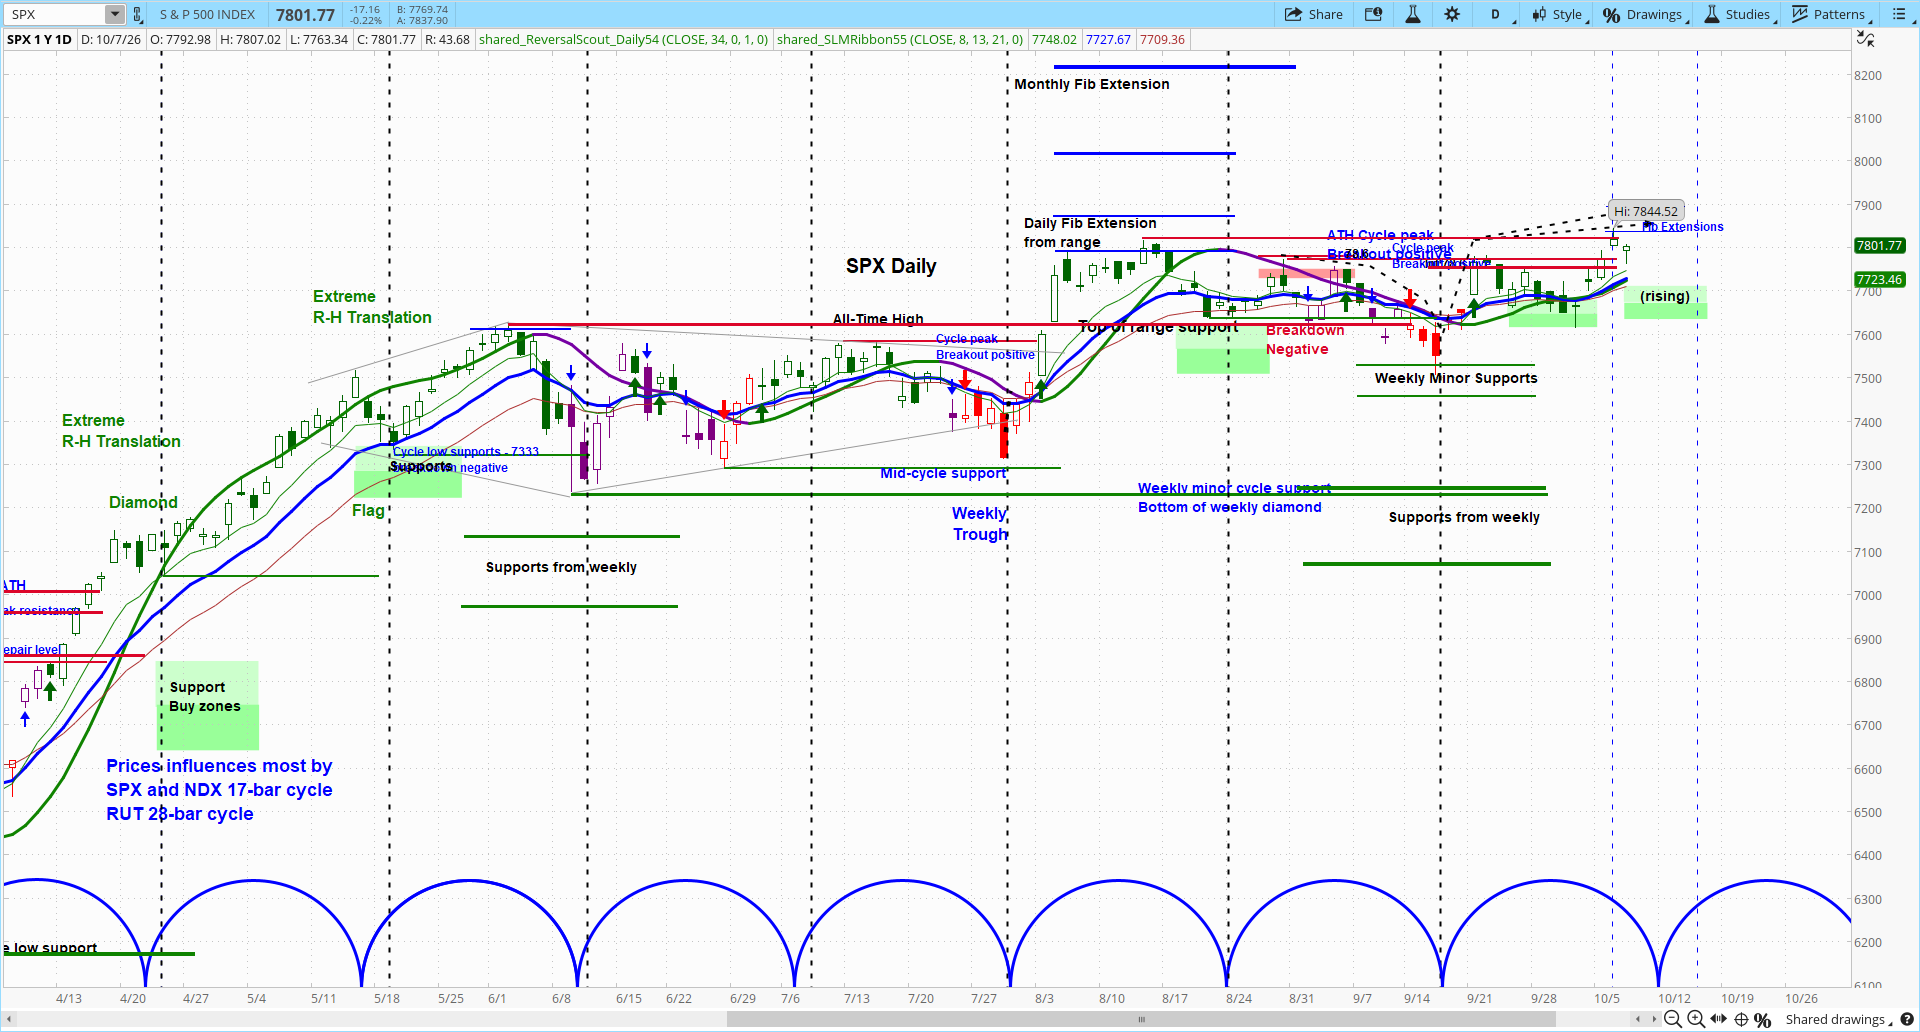
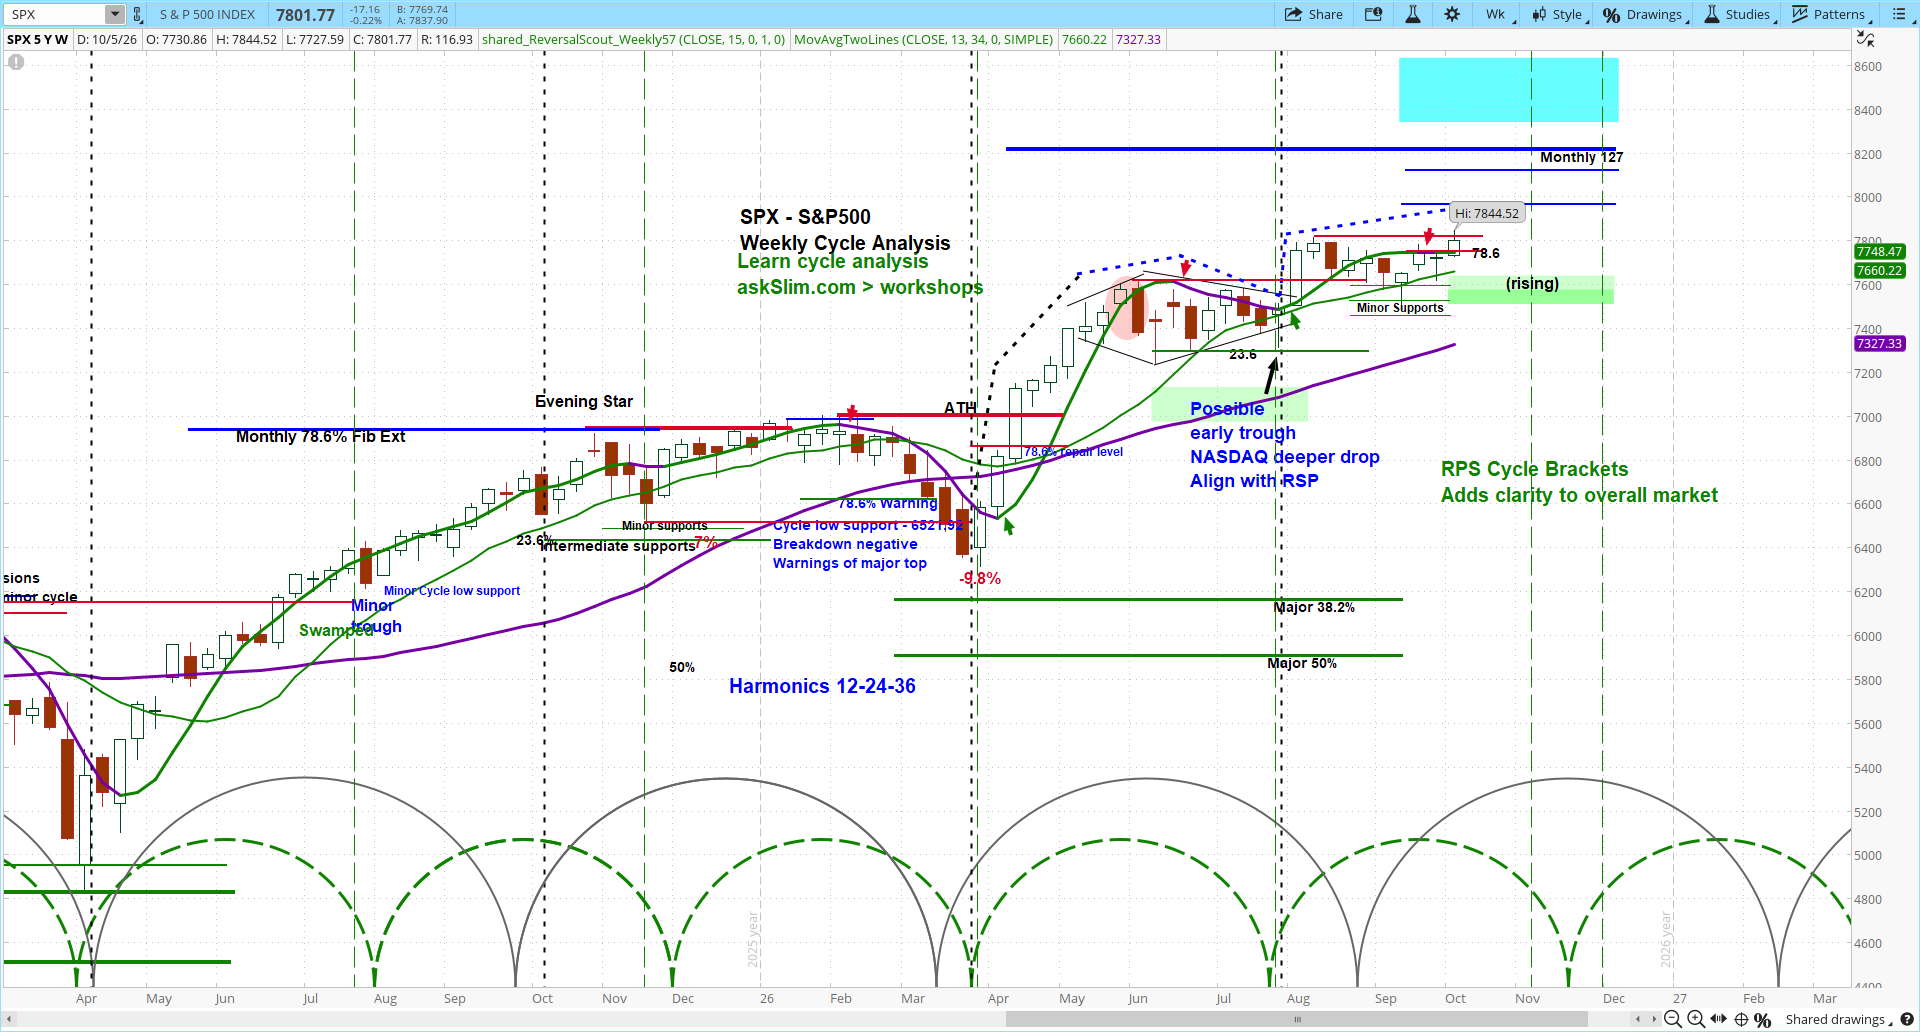
Important Notes: PRO TIP & Overview: Index Technical Summaries S&P 500 (SPX) Short-Term Technical Roadmap (Few Days-Few Weeks) Short Term Directional Bias: BULLISH (upgraded from NEUTRAL to SLIGHTLY BEARISH on (10/5/26) *THE READ: From a bigger picture perspective, the SPX is trading at the top-end of the range that has produced both tight and wide price chop since the beginning of August. A daily close below 7635 would neutralize the positive pattern structure and require a re-evaluation of the current projections. NOTE: The SPX entered a new daily cycle low timing window that runs through 10/14. A daily close below 7757 with the 2hr SR shifting negative will suggest the SPX has peaked and entered the declining phase of the current daily cycle. Upside: The next upside projections given the positive pattern structures include 7817 (reached yesterday, then 7907. A daily close below 7683 would required a re-evaluation. Downside: Last week the SPX tested the lower-end of a short-term support zone and found some buying interest trigger a new leg to the upside. Currently 7758-7731-7704 are the support zones to monitor. For further details into the SPX’s daily and weekly cycle conditions, including structure, phase, and projected timing windows, please refer to the Cycle Analysis Table below. Nasdaq 100 (NDX) To see all of the NDX Charts, Projections, Overviews, Trend Conditions, and Momentum analysis put out every trading day in our Stock Index Report (SIR) Daily Snapshot, join our Level 1 membership level today! Russell 2000 (RUT) To see all of the RUT Charts, Projections, Overviews, Trend Conditions, and Momentum analysis put out every trading day in our Stock Index Report (SIR) Daily Snapshot, join our Level 1 membership level today! S&P 500 Charts “If you are day trading then Matt’s intraday charts are really amazing. The price levels Matt identified were perfect reaction points”- Brad B. “This new Charts Hub is spectacular” – Mike K. “The way you guys map out the zones is unbelievable with accuracy & when the price hits those zones. I wish I had that skill WOW thanks AskSlim Crew” – Thomas R. Slim’s Annotated SPX Daily Chart with additional Slim Ribbon Momentum Indicator and Reversal Scout Slim’s Annotated SPX Weekly Chart with “Reversal Scout” S&P 500 – askSlim Analyst Matt’s Trade Planning Price Projections S&P 500 – askSlim Analyst Matt’s Trade Planning Price Projections — SPX Intermediate-Term (1-2 Months) & Longer-Term (3-6 Months) Outlooks The full SPX Intermediate-Term & Long-Term Outlooks including Price Projections, Upside/Downside Overviews, Trend Conditions, and Momentum analysis are published by 8PM CST every trading day in our premium Stock Index Report (SIR) Daily Snapshot. TECHNICAL EVIDENCE COMPARISON Momentum Tracker & Charts askSlim Trend & Momentum Tracker 2hr Intraday Area Chart “Comparison” with SLIM Ribbon Momentum Indicator & MCI tastytrade - Our Preferred Options Trading Platform tastytrade, Inc. (“tastytrade”) has entered into a Marketing Agreement with Ask Slim (“Marketing Agent”) whereby tastytrade pays compensation to Marketing Agent to recommend tastytrade’s brokerage services. The existence of this Marketing Agreement should not be deemed as an endorsement or recommendation of Marketing Agent by tastytrade and/or any of its affiliated companies. Neither tastytrade nor any of its affiliated companies is responsible for the privacy practices of Marketing Agent or this website. tastytrade does not warrant the accuracy or content of the products or services offered by Marketing Agent or this website. Marketing Agent is independent and is not an affiliate of tastytrade. Idealized Cycle Diagram: timeframes definitions/outlook periods :
The NDX closed down about 64 points at 31,160.07

The RUT closed down about 37 points at 2793.20
askSlim Charts
Like these charts? With a Level 2 askSlim membership, you can utilize our LIVE SPX charts during market hours for less than $3 per trading day! You’ll also get 24/7 access to over 150 static charts for the most popular symbols in our new “Charts Hub”. Here’s what some of our members have said about our charts…

Time Horizon
Direction
Projection
Status
Invalidation
Indicated Date
Reached Date
Short Term
1 to 3 WeeksUpside
7749, then 7814-7830* ACTIVE
A daily close below 7612 would required a re-evaluation.
9/3
Projection 1 (9/21)
Projection 2 (10/6)
Downside
7591-7567, then 7548-7507
satisfied (Inactive)
9/9
9/10, 9/16
Intermediate Term
1 to 2 MonthsUpside
7787–7975 * ACTIVE
Daily close below 7507
8/3
Updated 8/13—
Downside
—
* INACTIVE
—
—
—
Longer Term
3 to 6 MonthsUpside
7688–7800
7801–7880* ACTIVE
Daily close below 7237
6/15
8/4/26
8/13
Downside
—
* INACTIVE
—
—
—
Click here to sign up for a Level 1 askSlim.com membership today to see the full report!
INDEX
L-T
Trend ConditionL-T
Momentum Condition
I-T
Trend ConditionI-T
Momentum Condition
S-T
Trend ConditionS-T
Momentum Condition
N-T
Trend ConditionN-T
Momentum Condition
MCI READING
(-100 to +100), >25 =positive <-25=negative) MCI RATE OF CHANGE FROM PREVIOUS UPDATE
SPX

90
+8
NDX
96
-4
RUT


-92
-8